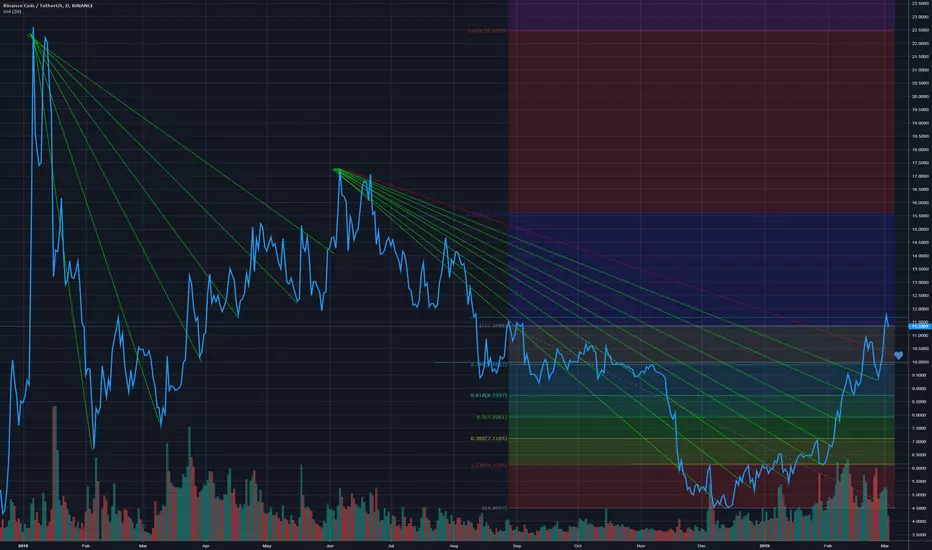
- Volumes are not enough to break the previous resistance, that's why in the past three days we have seen two strong resistances at 11.6$ which were not broken.
- If you look at green candlestick (1D timeframe), you will see that always, after 4/5 candlesticks the price recorrects itself by dropping. We are now at 4th.
- By looking at the green lines on the graphs, the uptrend follows a logic, which suggests a drop
- The main trend-line is almost in the "blu zone" with Fibonacci.
For these reasons I do not think it will go up now, but will drop and reach the heart point (about 10.5$), to recover after some day.
Be carefull guys.
免責聲明
這些資訊和出版物並非旨在提供,也不構成TradingView提供或認可的任何形式的財務、投資、交易或其他類型的建議或推薦。請閱讀使用條款以了解更多資訊。
免責聲明
這些資訊和出版物並非旨在提供,也不構成TradingView提供或認可的任何形式的財務、投資、交易或其他類型的建議或推薦。請閱讀使用條款以了解更多資訊。