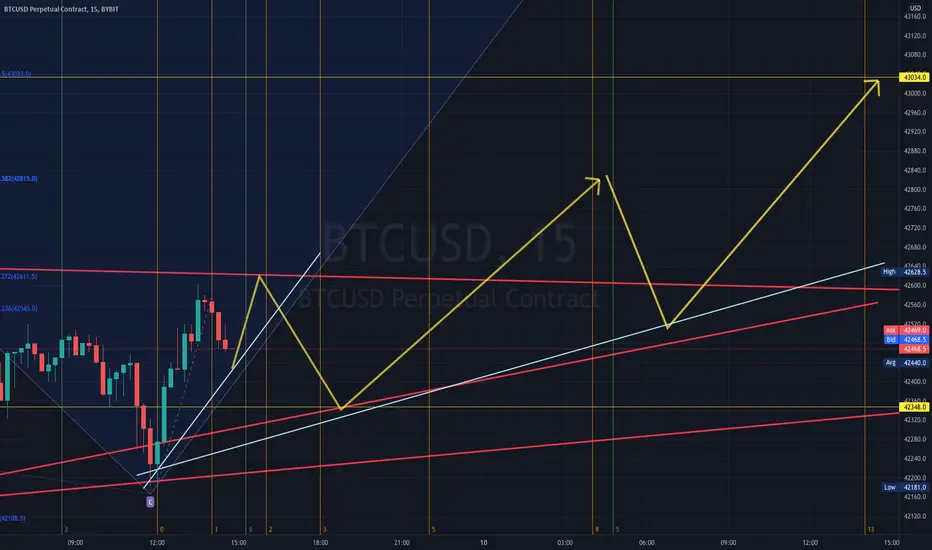
Using Fibonacci/ harmonic patterns - this chart shows in general what price action may do over the next 8 hours.
*with certainty price will not follow this chart precisely (it's possible it may not follow at all)
posting charts like this keeps me sharp and constantly improving - as posting this publicly adds pressure to my charting - to constantly improve on accuracy.
Do not trade around this chart as well as it is entirely speculative, however it could be used as a reference if price action is following this general movement
As always good luck and best regards
免責聲明
這些資訊和出版物並不意味著也不構成TradingView提供或認可的金融、投資、交易或其他類型的意見或建議。請在使用條款閱讀更多資訊。