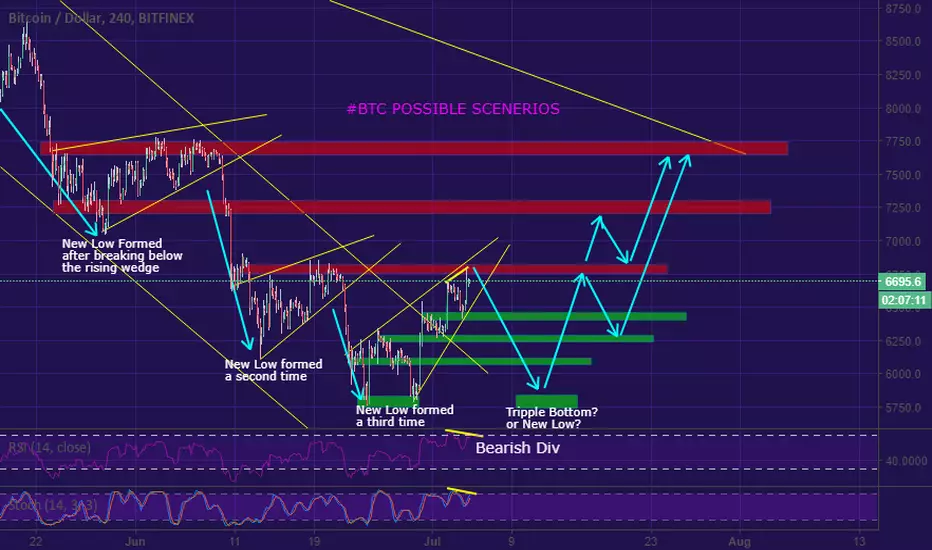
ARE WE HEADING FOR A NEW LOW OR A TRIPPLE BOTTOM?........ The similar price move as depicted on the 4 hour chart could be pointing our attention to a possible new low, or a tripple bottom.
Bears Holding up from here......chart looks bearish right now, a retest of the lower boundary is imminent from this point.
Bearish Divergence seen on the 4 hour time frame.
RSI nearing overbought and STOCH at upper extreme end.
Rising wedge formation and a gradually declining volume in the last 4 hours......(the bearish condition seems to have been spotted, thereby leading to a decreasing volume)
A hoslistic view of the 4 hour chart shows that, there has been 5 successive rising wedge formation since Feb 2018.
Out of the 5 rising wedge formation, 3 has successively formed a new low on every break below it since April this year.
However, an interesting point to note here is that the last low actually formed a double bottom at $5760 because the bulls defended that position and prevented price from falling below it. Are we seeing a new low from here, ow will the bulls defend the previous low again?
免責聲明
這些資訊和出版物並不意味著也不構成TradingView提供或認可的金融、投資、交易或其他類型的意見或建議。請在使用條款閱讀更多資訊。
免責聲明
這些資訊和出版物並不意味著也不構成TradingView提供或認可的金融、投資、交易或其他類型的意見或建議。請在使用條款閱讀更多資訊。