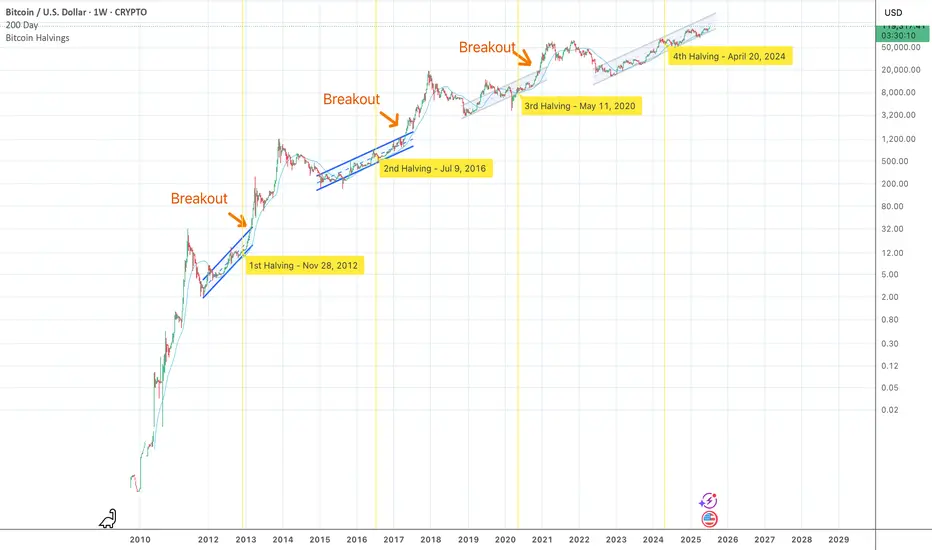
As of July 2025 Bitcoin trades near $120 000 and every weekly close since the November 2022 low has stayed inside the same rising log-channel. The channel’s upper rail is ≈ $170 000 today and should reach ≈ $230 000 by December. A decisive breakout requires a weekly close above that rail. In previous cycles the breakout came almost exactly at the prior all-time high, but this time the 2021 ATH of $69 000 was reclaimed while price was still inside the channel. The trigger is therefore less obvious; yet if price finally closes beyond the rail, a new exponential leg is expected to begin.
Two structural shifts explain the delay. First, the channel’s slope keeps flattening: early cycles rose about 0.6 % per day on a log scale, now it is roughly 0.15 %. Second, each order-of-magnitude move demands vastly more capital, so the supply squeeze after the April 2024 halving is taking longer to translate into price.
At past tops growth multiples fell from 36× (2013) to 16× (2017) to 3.5× (2021). Extending that trend points to roughly 1.5–2× from the future breakout price. If the breakout happens near $170 000–230 000 the projected new ATH lands around $250 000–360 000, a range that lines up with the red-orange band on the updated Bitcoin Rainbow Chart.
Historically peaks follow a breakout by 9–13 months and the halving by 16–20 months, placing the most probable time window in Q4 2025. Until the weekly candle settles above the channel roof Bitcoin remains in accumulation mode and the classic blow-off phase is still ahead.
免責聲明
這些資訊和出版物並不意味著也不構成TradingView提供或認可的金融、投資、交易或其他類型的意見或建議。請在使用條款閱讀更多資訊。