1. Trendlines
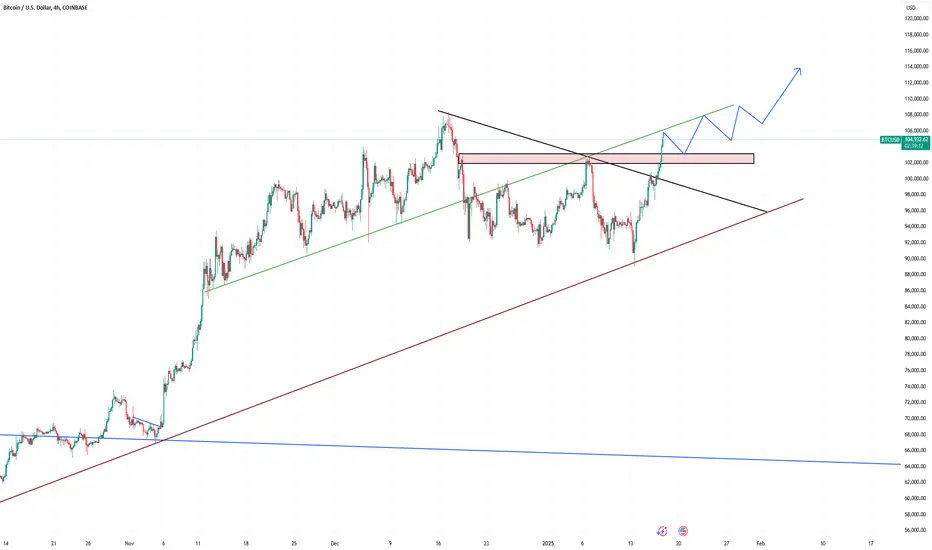
Green Ascending Trendline: Indicates an ongoing bullish trend, connecting higher lows and showing upward momentum.
Blue Long-Term Trendline: Suggests a stronger long-term support level that aligns with the overall bullish structure.
Black Descending Trendline: Marks a resistance zone from a previous downtrend, now broken, signaling a potential trend reversal.
2. Key Price Levels
Pink Horizontal Zone (Resistance Turned Support): Highlights a critical area around $102,000 to $104,000. This area acted as resistance but was broken and may now serve as support.
Current Price: The BTC/USD pair is trading around $105,000, showing strong bullish momentum.
3. Price Projection
Blue Arrows: Indicate a potential bullish continuation pattern, where the price could consolidate around the broken resistance ($102,000-$104,000) before making another upward move toward $110,000 or higher.
Consolidation Zones: Suggest minor corrections or pullbacks before the next upward push.
4. Market Sentiment
The break of the descending trendline and the successful retest of support levels signal a bullish outlook.
The chart suggests confidence in higher highs, with a steady uptrend intact.
免責聲明
這些資訊和出版物並不意味著也不構成TradingView提供或認可的金融、投資、交易或其他類型的意見或建議。請在使用條款閱讀更多資訊。