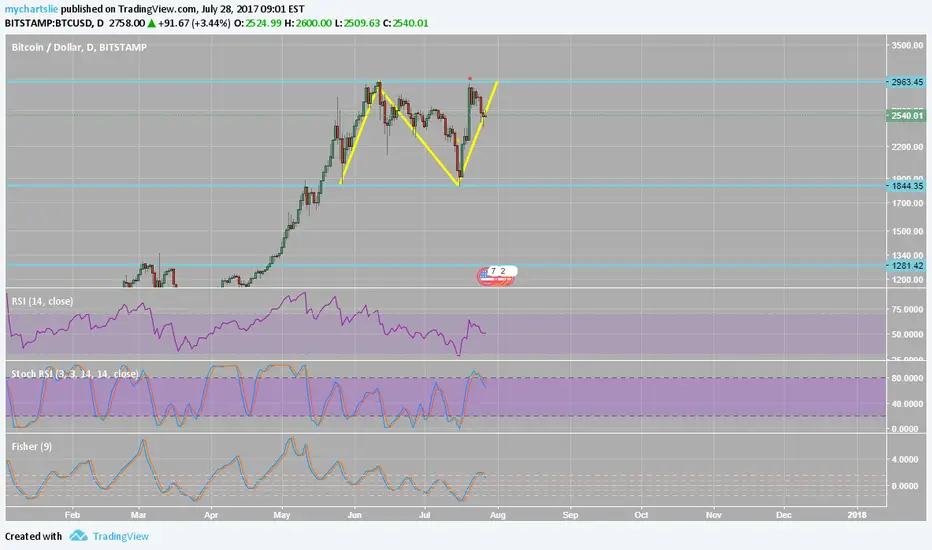
I know it's hard for many of you to believe, but you must at least consider the alternative view. This appears to be a textbook double top reversal pattern.
stockcharts.com/school/doku.php?id=chart_school:chart_analysis:chart_patterns:double_top_reversal
From their website:
The Double Top Reversal is a bearish reversal pattern typically found on bar charts, line charts and candlestick charts. As its name implies, the pattern is made up of two consecutive peaks that are roughly equal, with a moderate trough in-between.
...Although there can be variations, the classic Double Top Reversal marks at least an intermediate change, if not a long-term change, in trend from bullish to bearish. Many potential Double Top Reversals can form along the way up, but until key support is broken, a reversal cannot be confirmed. To help clarify, we will look at the key points in the formation and then walk through an example.
Prior Trend: With any reversal pattern, there must be an existing trend to reverse. In the case of the Double Top Reversal, a significant uptrend of several months should be in place.
First Peak: The first peak should mark the highest point of the current trend. As such, the first peak is fairly normal and the uptrend is not in jeopardy (or in question) at this time.
Trough: After the first peak, a decline takes place that typically ranges from 10 to 20%. Volume on the decline from the first peak is usually inconsequential. The lows are sometimes rounded or drawn out a bit, which can be a sign of tepid demand.
Second Peak: The advance off the lows usually occurs with low volume and meets resistance from the previous high. Resistance from the previous high should be expected. Even after meeting resistance, only the possibility of a Double Top Reversal exists. The pattern still needs to be confirmed. The time period between peaks can vary from a few weeks to many months, with the norm being 1-3 months. While exact peaks are preferable, there is some leeway. Usually a peak within 3% of the previous high is adequate.
Decline from Peak: The subsequent decline from the second peak should witness an expansion in volume and/or an accelerated descent, perhaps marked with a gap or two. Such a decline shows that the forces of demand are weaker than supply and a support test is imminent.
Support Break: Even after trading down to support, the Double Top Reversal and trend reversal are still not complete. Breaking support from the lowest point between the peaks completes the Double Top Reversal. This too should occur with an increase in volume and/or an accelerated descent.
Support Turned Resistance: Broken support becomes potential resistance and there is sometimes a test of this newfound resistance level with a reaction rally. Such a test can offer a second chance to exit a position or initiate a short.
Price Target: The distance from support break to peak can be subtracted from the support break for a price target. This would infer that the bigger the formation is, the larger the potential decline.
...While the Double Top Reversal formation may seem straightforward, technicians should take proper steps to avoid deceptive Double Top Reversals. The peaks should be separated by about a month.
註釋
The peaks were indeed separated by about a month. Resistance at 3000, support to break is about 1850. As I've been saying, we MUST retest the previous ATH peak at 1300 before the next big move up. It's healthy and necessary.免責聲明
這些資訊和出版物並不意味著也不構成TradingView提供或認可的金融、投資、交易或其他類型的意見或建議。請在使用條款閱讀更多資訊。
免責聲明
這些資訊和出版物並不意味著也不構成TradingView提供或認可的金融、投資、交易或其他類型的意見或建議。請在使用條款閱讀更多資訊。