比特幣
已更新

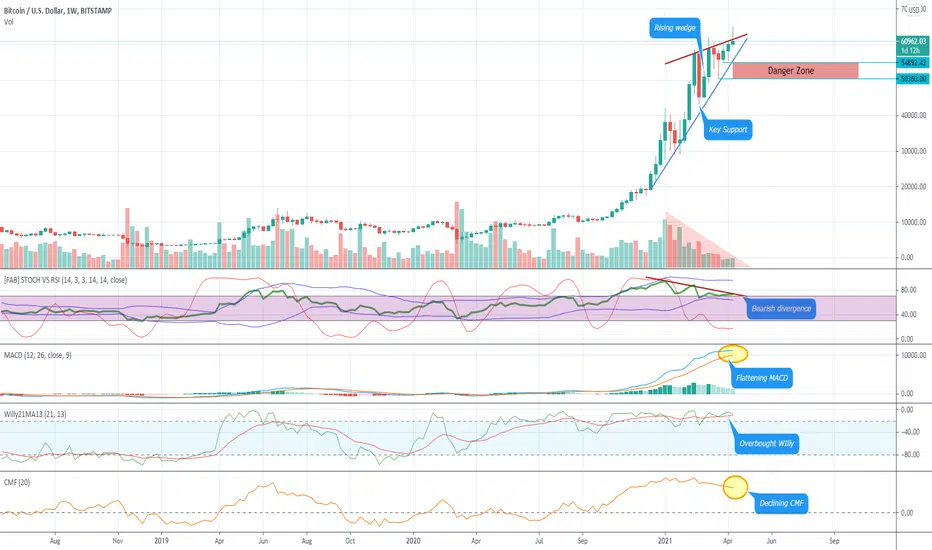
Volume makes it tricky. Watch out for a possible dump.

2 235
We have declining volume and some bearish hints.

Unless volume picks up + Bitcoin manages to breakout/reject the wedge the odds for a sensible correction will grow, day by day.

Keep an eye on support, don't take more risk on a confirmed breadown.
Be vigilant in case of price moving down to the 50-55k danger zone.
Have a SL.
註釋
Straight down into the danger zone.
We just saw a > 10.000$ swing down to 51.000$, all this within about 24hrs.

快照

Now bouncing.
Watch out, that's hardly over.
註釋
Awaiting breakout of the 1H triangle.

快照

Bounce or slump.
註釋
Usual futures expiration volatility.
Let's wait and see the dust settle.
註釋
Nothing new so far.

快照

Bears keep in control under 57k.
註釋
Danger zone pierced, we're in troublesome waters.

That said 1H hints a bounce looming.

快照

Be aware of risks: that's like catching a fallling knife.
No warranty.
註釋
The whole picture, as per opening post:

快照

Today close matters.
註釋
Bouncing.
look at close tonight.

快照

IF it can manage to place a close over 50k and paint a hammer may bounce further.
註釋
Meanwhile on TF 1H:
快照

Playing nice, let's see how far it can keep with the arrow.
If it manages to touch resistance it may try to confirm that falling wedge, eventually.
註釋
As usual, be careful.
Here you're playing with fire.
註釋
Bit late, but bounce ongoing after TD count=9.

快照

Fair enough.
註釋
Testing top of danger zone.

快照
註釋
Still not out of the woods, so far.
註釋
Vertex of rising wedge.
Watch it, as if the pattern gets confirmed a dip towards 51k area may happen.

快照
註釋
Here we go.

快照

Let's see, i would welcome an inverted H&S.
Soon to say.
註釋
Looks a inverted H&S indeed.

Small right shoulder ( did not pierce 52k), but at neckline already:

快照

We'll see.
Hopefully it will achieve a pullback to previous support, now resistance.
註釋
Have a trailing stop.
註釋
Pullback ongoing, close to 60k mark but failing to nail the critical 62k area.

All we have is some uninteresting price action on low volume.

快照

We have a rising wedge, so watch out.

For now we have to wait for some volume to kick in in order to make any meaningful evaluation. No hurry.
註釋
Pullback to wedge support (now resistance) and down again.

快照

Ugly.
註釋
Let's consider bad and worst (dashed) scenario, for a moment.

快照

Whatever will happen, that's enough to use some caution if you're Long ....
Watch out.
註釋
Anything below the light blue support on close would call for trouble.
註釋
Guess what ?

快照

;)
註釋
Watch it carefully. Whole scenario:

快照

Ongoing critical test of MM20/W.
註釋
Chart update, some lines removed for clarity.

快照

It may find support on the fuchsia line and bounce.
Otherwise down to target box ( see post above )
註釋
First 30% correction of year achieved ( close price computation ).
Historically buying 30% correction for long term holding is rewarding.

See below: red bars are BUYs on 30% corrections.
Blue bars are monthly buys (e.g. accumulation plan ).

快照

Historically (from 2010 onwards) red chart outperforms blue chart.
Nowadays by about 100%.

Meaning that buyng the dips usually outperforms accumulation.
That's why i always buy this kind of dip, even repeatedly, without caring about the ongoing weakening.
註釋
No bounce, straight to target box.
Very impulsive move, no buying pressure so far.

快照

This spells for trouble unless we can get a bounce by weekly close.

免責聲明

這些資訊和出版物並不意味著也不構成TradingView提供或認可的金融、投資、交易或其他類型的意見或建議。請在使用條款閱讀更多資訊。