ROS #Repeat of structure
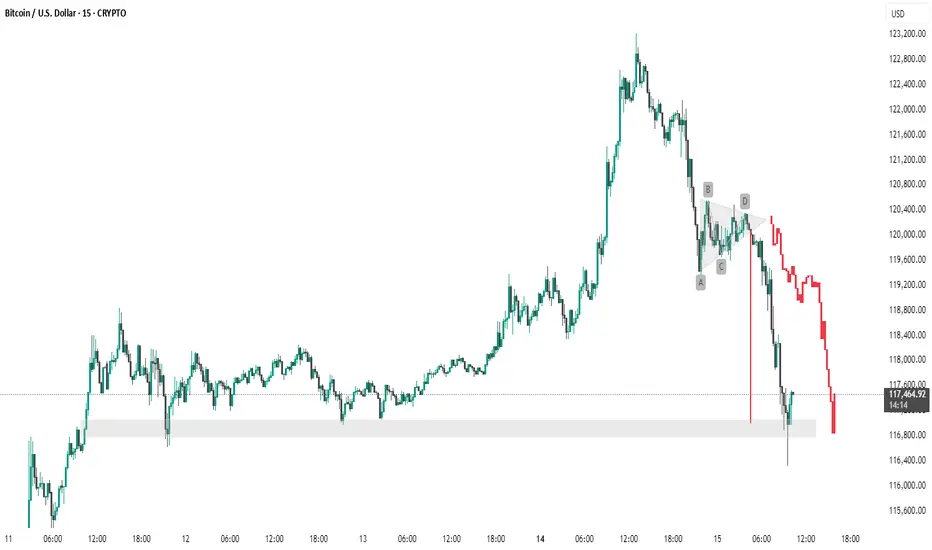
The chart you've provided is a 15-minute candlestick chart of **Bitcoin (BTC) / USD**, showing a recent price action pattern followed by a significant drop. Here are the **key points** identified on the chart:
**Key Support Zone**
* Highlighted in **light gray** at the bottom.
* Range: **\~116,800 to \~117,500 USD**
* This zone has acted as **support multiple times** (seen around July 11–12 and now again on July 15).
* Price **bounced** off this area during the most recent dip, but the current candle is testing it again.
---
**Chart Pattern: Bearish Triangle (ABCD Structure)**
Marked by the labels **A, B, C, D**, forming a **descending triangle**, typically a **bearish continuation pattern**:
* **A to B:** Sharp drop (initial leg down).
* **B to C:** Rebound, but fails to reclaim highs.
* **C to D:** Tightening price action inside the triangle.
* After **D**, there’s a **breakdown**, leading to heavy selling.
---
**Breakdown and Sharp Decline**
* Price **breaks below the triangle support** with a long red candle.
* Massive sell-off continues, pushing BTC below **\$118,000**.
* The current price is around **\$117,481**, hovering near the key support zone.
---
**Trend Observation**
* Before the triangle, there was a **strong uptrend** leading up to \~\$123,000.
* The triangle acted as a **distribution zone** before the **reversal** began.
* The trend has shifted from **bullish** to **bearish** post-pattern.
---
🔍 Summary of Key Levels:
| Level Type | Price Range |
| ---------------- | ------------------- |
| Resistance (Top) | \~\$123,000 |
| Breakdown Point | \~\$120,400 |
| Support Zone | \~\$116,800–117,500 |
thanking u
免責聲明
這些資訊和出版物並不意味著也不構成TradingView提供或認可的金融、投資、交易或其他類型的意見或建議。請在使用條款閱讀更多資訊。
免責聲明
這些資訊和出版物並不意味著也不構成TradingView提供或認可的金融、投資、交易或其他類型的意見或建議。請在使用條款閱讀更多資訊。