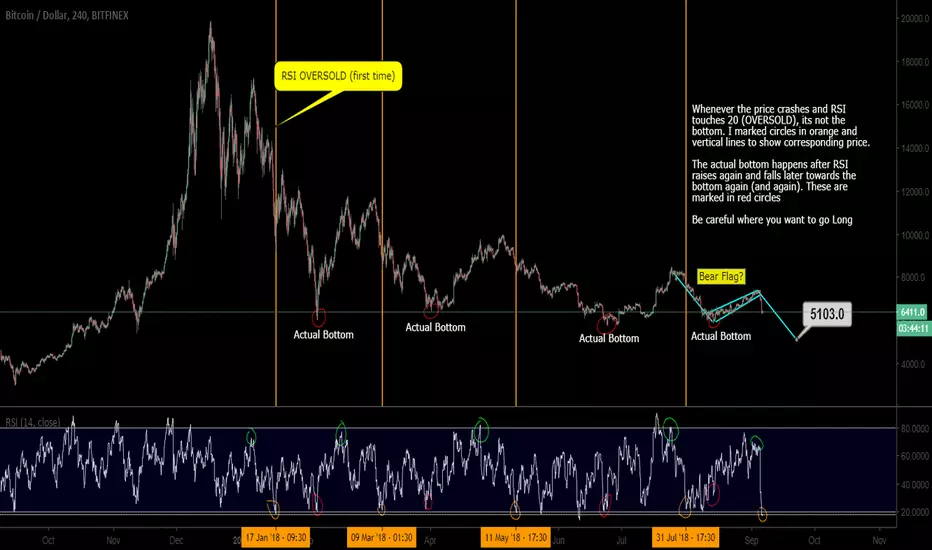
The 4Hour chart shows RSI below 20, which is OVERSOLD. But before you invest, know that its not the actual bottom
Whenever the price crashes and RSI touches 20 (OVERSOLD), its not the bottom. I marked circles in orange and vertical lines to show corresponding price.
The actual bottom happens after RSI raises again and falls later towards the bottom (RSI=20-30) again (and again). These are marked in red circles
Note the bear flag (blue) and the length of the pole is at 5k
Be careful where you want to go Long. Feel free to ask questions
註釋
Its been 6 days, when do you think we hit the bottom (chart update with days)Follow me for more updates
twitter.com/imkeshav
youtube.com/channel/UCskbBdZstBUQ_4y2o912zzw
twitter.com/imkeshav
youtube.com/channel/UCskbBdZstBUQ_4y2o912zzw
相關出版品
免責聲明
這些資訊和出版物並不意味著也不構成TradingView提供或認可的金融、投資、交易或其他類型的意見或建議。請在使用條款閱讀更多資訊。
Follow me for more updates
twitter.com/imkeshav
youtube.com/channel/UCskbBdZstBUQ_4y2o912zzw
twitter.com/imkeshav
youtube.com/channel/UCskbBdZstBUQ_4y2o912zzw
相關出版品
免責聲明
這些資訊和出版物並不意味著也不構成TradingView提供或認可的金融、投資、交易或其他類型的意見或建議。請在使用條款閱讀更多資訊。