Sharing my current view on the macro price structure of Bitcoin, outlining both main and alternative scenarios based on trend wave analysis.

Macro Trend Overview and Main scenario
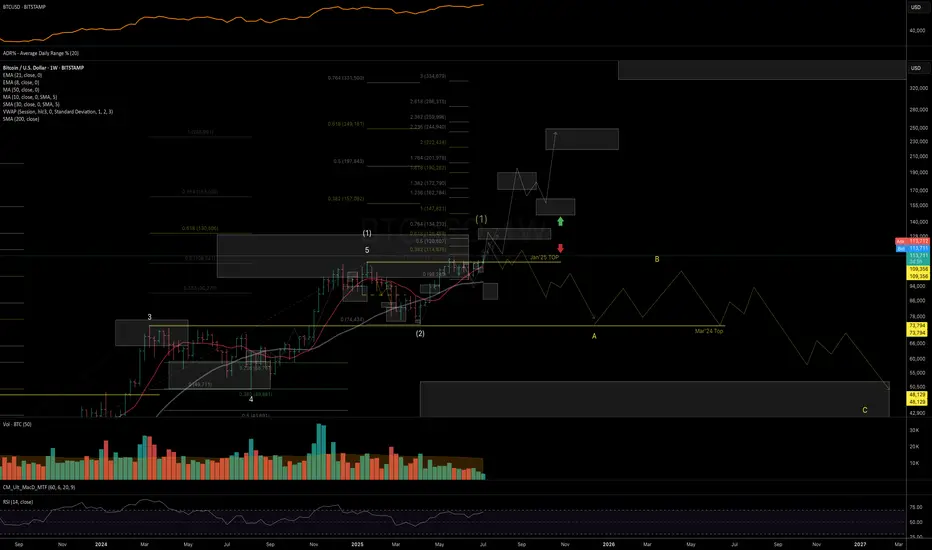
The uptrend from the Nov ’22 bottom shows a classic 5-wave impulsive structure, closely aligning with ideal Fibonacci proportions:
Wave 3 peaked within the 1.382–1.618% zone
Wave 4 found support in the 1.236–1.000% area
Wave 5 topped near the 2.000% / 0.618% projection (measured from the Nov’18 bottom to Nov’21 top, projected from the Nov’22 low)

Wave (2) was relatively short in time and depth, but technically acceptable as complete. Given the broader technical structure, macro fundamentals, policy tailwinds, and social sentiment - I consider wave (2) to be finished.
The rally from April’25 low to May’25 high looks impulsive, followed by a clean three-wave pullback into the June’25 low - a structure consistent with the start of a new uptrend, within a larger degree wave (3).
If this is the case, given the fractal nature of the markets, price should Fibonacci proportions similar to the Nov’22 - Mar’24 cycle.
For this bullish count to remain valid, BTC must break and hold above the 126–134K resistance zone. This would open the door to next resistance zone be tested nex: 170–190K and 200–220/250K, where I’d expect a major top to begin forming, possibly, the start of a multi-year higher low formation.

Alternative Scenario
If price fails to break above 126–134K and starts showing reversal patterns, then the yellow count remains valid suggesting the entire trend from Nov’22 has peaked, and BTC could be entering a deep, prolonged correction (as per the yellow count).
In Summary
As long as weekly closes stay above 111.9K, my base case favors continued upside into 125–135K, where the next major decision zone lies:
• Either a short consolidation before breakout
• Or formation of a macro top
For more detailed levels and daily trend structure (including ETH, SOL, XRP, and HYPE), check out my recent video idea and Minds post.
Thank you for your attention and I wish you successful trading decisions!
If you found this idea helpful, I’d really appreciate a boost — and would be glad to have you as a subscriber!
Thank you for your attention and I wish you successful trading decisions!
* I'm keeping the same structure read from my public Mar'24 analysis: [url= tradingview.com/chart/BTCUSD/QKQpcHd8-btc-volnovaya-struktura-trenda-s-noyabrya-2022/]
Macro Trend Overview and Main scenario
The uptrend from the Nov ’22 bottom shows a classic 5-wave impulsive structure, closely aligning with ideal Fibonacci proportions:
Wave 3 peaked within the 1.382–1.618% zone
Wave 4 found support in the 1.236–1.000% area
Wave 5 topped near the 2.000% / 0.618% projection (measured from the Nov’18 bottom to Nov’21 top, projected from the Nov’22 low)
Wave (2) was relatively short in time and depth, but technically acceptable as complete. Given the broader technical structure, macro fundamentals, policy tailwinds, and social sentiment - I consider wave (2) to be finished.
The rally from April’25 low to May’25 high looks impulsive, followed by a clean three-wave pullback into the June’25 low - a structure consistent with the start of a new uptrend, within a larger degree wave (3).
If this is the case, given the fractal nature of the markets, price should Fibonacci proportions similar to the Nov’22 - Mar’24 cycle.
For this bullish count to remain valid, BTC must break and hold above the 126–134K resistance zone. This would open the door to next resistance zone be tested nex: 170–190K and 200–220/250K, where I’d expect a major top to begin forming, possibly, the start of a multi-year higher low formation.
Alternative Scenario
If price fails to break above 126–134K and starts showing reversal patterns, then the yellow count remains valid suggesting the entire trend from Nov’22 has peaked, and BTC could be entering a deep, prolonged correction (as per the yellow count).
In Summary
As long as weekly closes stay above 111.9K, my base case favors continued upside into 125–135K, where the next major decision zone lies:
• Either a short consolidation before breakout
• Or formation of a macro top
For more detailed levels and daily trend structure (including ETH, SOL, XRP, and HYPE), check out my recent video idea and Minds post.
Thank you for your attention and I wish you successful trading decisions!
If you found this idea helpful, I’d really appreciate a boost — and would be glad to have you as a subscriber!
Thank you for your attention and I wish you successful trading decisions!
* I'm keeping the same structure read from my public Mar'24 analysis: [url= tradingview.com/chart/BTCUSD/QKQpcHd8-btc-volnovaya-struktura-trenda-s-noyabrya-2022/]
📊 Daily FREE Market Insights | Crypto + US Stocks
⚡ Technical analysis, setups & commentary
🌍 t.me/MarketArtistryENG | 🇷🇺 t.me/marketartistry
⚡ Technical analysis, setups & commentary
🌍 t.me/MarketArtistryENG | 🇷🇺 t.me/marketartistry
相關出版品
免責聲明
這些資訊和出版物並非旨在提供,也不構成TradingView提供或認可的任何形式的財務、投資、交易或其他類型的建議或推薦。請閱讀使用條款以了解更多資訊。