Bitcoin is showing bullish intent after breaking above a descending trendline resistance on the 1-hour chart. The breakout occurred with decent bullish momentum, suggesting buyers are regaining control in the short term.
📈 Chart Observations:
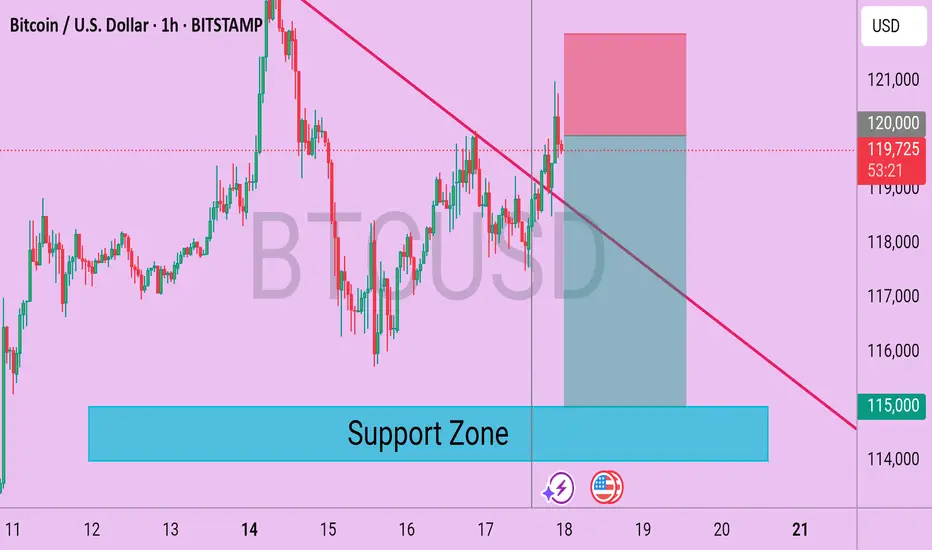
Descending Trendline Broken: Price has successfully broken above a well-respected descending trendline, which acted as resistance over the past few sessions. This breakout may signal a shift in short-term market structure.
Support Zone: The marked support zone around $115,000 continues to act as a critical demand area. Price has rebounded multiple times from this zone, reinforcing its significance.
Current Price Action: BTC is currently trading near $119,800, just under the round-level resistance of $120,000. A clean hourly close above this level could open room for further bullish continuation.
📊 Key Levels:
Resistance: $120,000 (Psychological level)
Immediate Support: $118,000
Major Support Zone: $115,000–$114,000
📉 Bearish Scenario:
If BTC fails to hold above the broken trendline and slips back below $118,000, a revisit of the support zone near $115,000 becomes likely. Bears may step in again if the price fails to sustain higher highs.
✅ Conclusion:
BTC is showing potential for a short-term bullish reversal after breaking out of its descending pattern. Traders should monitor for confirmation through price continuation above $120,000. However, a cautious approach is advised near resistance levels, and invalidation below $118,000 could favor sellers once again.
📈 Chart Observations:
Descending Trendline Broken: Price has successfully broken above a well-respected descending trendline, which acted as resistance over the past few sessions. This breakout may signal a shift in short-term market structure.
Support Zone: The marked support zone around $115,000 continues to act as a critical demand area. Price has rebounded multiple times from this zone, reinforcing its significance.
Current Price Action: BTC is currently trading near $119,800, just under the round-level resistance of $120,000. A clean hourly close above this level could open room for further bullish continuation.
📊 Key Levels:
Resistance: $120,000 (Psychological level)
Immediate Support: $118,000
Major Support Zone: $115,000–$114,000
📉 Bearish Scenario:
If BTC fails to hold above the broken trendline and slips back below $118,000, a revisit of the support zone near $115,000 becomes likely. Bears may step in again if the price fails to sustain higher highs.
✅ Conclusion:
BTC is showing potential for a short-term bullish reversal after breaking out of its descending pattern. Traders should monitor for confirmation through price continuation above $120,000. However, a cautious approach is advised near resistance levels, and invalidation below $118,000 could favor sellers once again.
免責聲明
這些資訊和出版物並不意味著也不構成TradingView提供或認可的金融、投資、交易或其他類型的意見或建議。請在使用條款閱讀更多資訊。