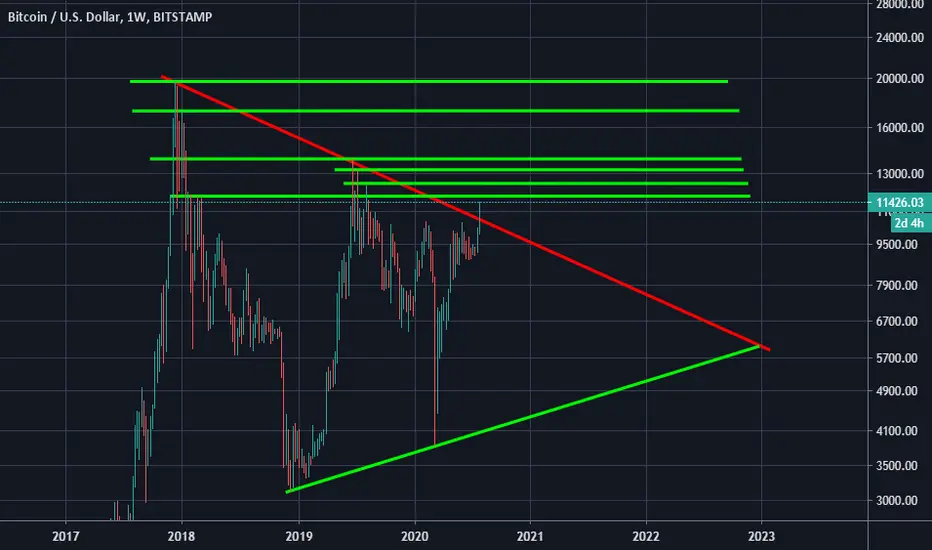
Back in August 2019 i first posted a chart explaining that bitcoin was in a Symmertrical Triangle, and now about 1 Year Later we finally broke out and now there are several areas of resistance to look out for: 11.7K, 12.4K, 13.4K, 13.8K, 17.1K & the top of the previous ATH @ 19.4-20K (depending on the exchange)
免責聲明
這些資訊和出版物並不意味著也不構成TradingView提供或認可的金融、投資、交易或其他類型的意見或建議。請在使用條款閱讀更多資訊。
免責聲明
這些資訊和出版物並不意味著也不構成TradingView提供或認可的金融、投資、交易或其他類型的意見或建議。請在使用條款閱讀更多資訊。