* We always provide both the bullish and bearish scenarios because the traders should be aware of what to expect in both cases.
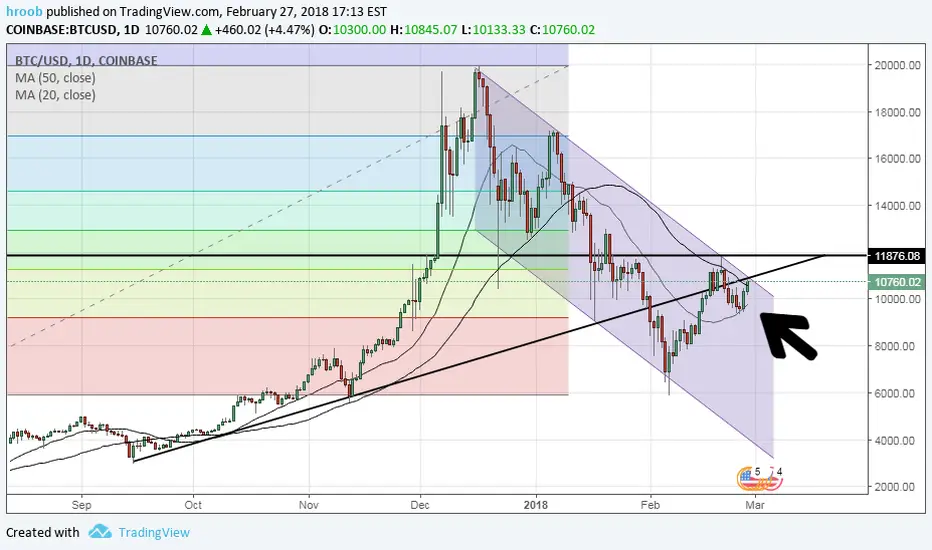
We had predicted a fall to $9100 level in our last analysis, but the price didn't reach our target and it bounced back from $9300. Now BTC is trading above 20-day EMA, however, it is very close to the upper line of the descending channel. This line of the channel coincides with the trendline ( as shown in the chart) and both behaved as a stiff resistance. Once the pulls succeed to break out the channel BTC may go to $11900 level. Above this level, BTC will be strongly bullish.
Conversely, If BTC can't break out the channel, it may retest $9300 level again.
Please be noted that I'm just giving the possible higher or lower levels developing according to the chart patterns. It's my own analysis. You should conduct your own research when making a decision.
相關出版品
免責聲明
這些資訊和出版物並不意味著也不構成TradingView提供或認可的金融、投資、交易或其他類型的意見或建議。請在使用條款閱讀更多資訊。