Introduction
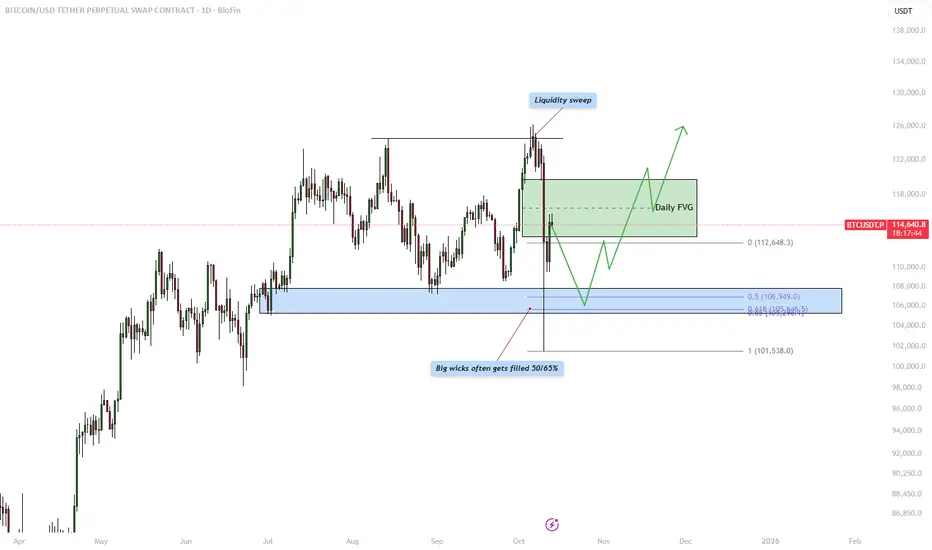
This analysis examines the recent price behavior of Bitcoin against USDT on the daily timeframe. The chart highlights several key technical concepts, including a liquidity sweep at the highs, a daily Fair Value Gap (FVG) acting as resistance, and the likelihood of a wick fill within a major imbalance zone. Together, these elements provide valuable insight into how institutional traders may be engineering liquidity and preparing for the next significant move. Understanding these areas can help traders anticipate high-probability reaction zones and better align with the market’s underlying structure.
Liquidity sweep
The market recently executed a liquidity sweep above previous swing highs, triggering buy stops and attracting breakout traders into the move. This sudden push to the upside was quickly rejected, signaling that smart money likely used this moment to gather liquidity and distribute positions. Liquidity sweeps often serve as the market’s way of collecting orders before a reversal or retracement, indicating that the bullish momentum may be temporarily exhausted. This event sets the stage for price to rebalance inefficiencies left behind during the rapid move.
Daily FVG resistance
Following the liquidity sweep, price left behind a clear daily Fair Value Gap, which represents an area of imbalance caused by strong displacement. This gap often acts as resistance, where price is expected to return and mitigate before potentially continuing lower. The FVG provides an ideal area for institutional traders to reposition, as it offers a point of confluence between inefficiency and structure. If price reacts bearishly within this zone, it would strengthen the bearish outlook and suggest a continuation toward lower levels.
Wick fill
The large wick seen during the recent sell-off is an important feature of this chart. Historically, big wicks tend to get filled by 50% to 65%, reflecting the market’s tendency to rebalance inefficiencies over time. The marked blue zone below shows where this fill is most likely to occur. This zone aligns closely with previous support levels and Fibonacci retracement levels, further reinforcing it as a potential area of interest. A wick fill into this region could provide liquidity for future bullish movement, allowing the market to establish a more solid foundation for the next impulsive leg upward.
Conclusion
In summary, the current daily structure of Bitcoin suggests that price has completed a liquidity sweep at the highs and is now in the process of rebalancing inefficiencies through a possible retracement. The daily Fair Value Gap above serves as a critical resistance zone where sellers may re-enter, while the wick fill area below marks a high-probability target for price to revisit before establishing new direction. Traders should monitor how price reacts to these two regions, a rejection from the FVG coupled with a move toward the wick fill zone could signal the next significant swing opportunity. In this environment, patience and precision are key, as the market seeks equilibrium before its next major directional move.
-------------------------
Thanks for your support. If you enjoyed this analysis, make sure to follow me so you don't miss the next one. And if you found it helpful, feel free to drop a like 👍 and leave a comment 💬, I’d love to hear your thoughts!
交易進行
The return lower is still on track. Lets watch 110k and otherwise BTC will move to 106/107k🔸 Free trading Discord
discord.gg/fVfJHHQSMG
🔹 Free trading signals
t.me/CandleCollective
discord.gg/fVfJHHQSMG
🔹 Free trading signals
t.me/CandleCollective
免責聲明
這些資訊和出版物並非旨在提供,也不構成TradingView提供或認可的任何形式的財務、投資、交易或其他類型的建議或推薦。請閱讀使用條款以了解更多資訊。
🔸 Free trading Discord
discord.gg/fVfJHHQSMG
🔹 Free trading signals
t.me/CandleCollective
discord.gg/fVfJHHQSMG
🔹 Free trading signals
t.me/CandleCollective
免責聲明
這些資訊和出版物並非旨在提供,也不構成TradingView提供或認可的任何形式的財務、投資、交易或其他類型的建議或推薦。請閱讀使用條款以了解更多資訊。