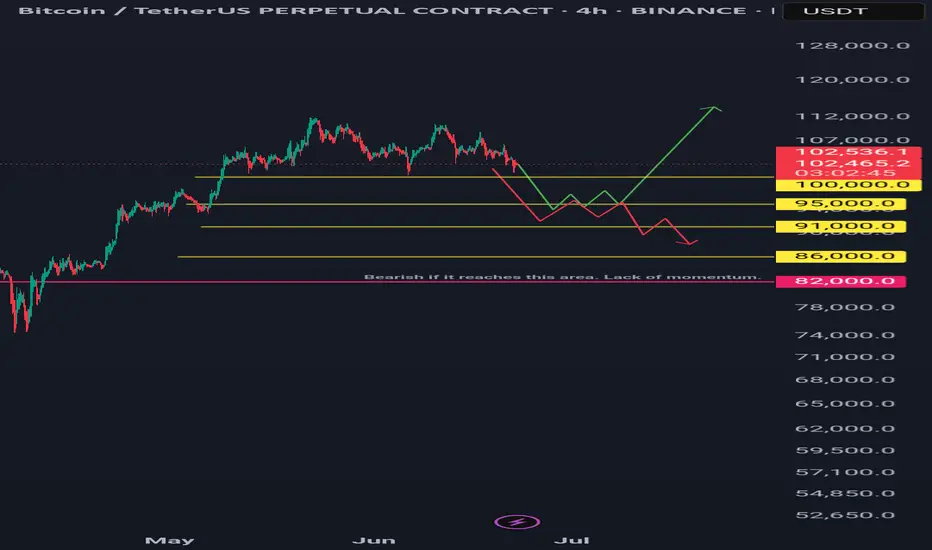
Two scenarios: green and red lines.
Green Line: A bounce and sustained recovery above the 100-day and 200-day daily moving averages is bullish.
Red Line: A bounce followed by a lack of momentum and a break below a previous low is bearish.
Long Horizontal Red Line: If the price reaches this area, it could signal the start of a downtrend unless new bullish fundamentals emerge.
My Point of View (POV): I am bearish, primarily due to the ongoing war, similar to the conflict that began between two other countries a year ago.
However, it's important to note that every crisis and recession has historically presented a buying opportunity for institutions and 'whales.' Therefore, be prepared with funds for dollar-cost averaging (DCA), then simply hold and forget. It is recommended to conduct backtesting and research to identify optimal buying areas. DCA is key. Only invest money you can afford to lose.
註釋
It closed below 100k but immediately recovered. Was that a liquidity sweep? I'm not entirely sure.
On the other hand, the 100-day moving average and 200-day moving average might form a bullish golden cross if it closes green on the daily time frame.
Also, there are two diagonal lines that may act as resistance ahead.
註釋
But if we take a look at the daily time frame, 100k is acting as good support.As long as it didn't close below 100k we can consider this as a good and a healthy move/consolidation.
Rsi- seems good, still in bullish area.
註釋
It broke out from diagonal resistance and formed a bullish head and shoulders pattern. Let's see if it continues.
If it does, it may reach the 111k and 114k areas.
If 108k resists, it's a sign of weakness. I'm seeing no volume honestly.
註釋
coming from 108k resistance is sign of weakness. also a bearish ih&s pattern was formed on 1h tf and targets are 105500 and 106000 area.
also, looking at the gap below, it may fill this area first before we see an uptrend continuation.
註釋
Shorters are finished taking profits. We may retest the diagonal resistance soon. 108725 is the next horizontal resistance to break. If a retest occurs at this horizontal resistance, followed by a small swing and a break of this resistance with volume, we could see a significant upward move.
交易進行
Waiting for a close above resistance.
交易結束:目標達成
Two targets for this scenarios are already reached.免責聲明
這些資訊和出版物並不意味著也不構成TradingView提供或認可的金融、投資、交易或其他類型的意見或建議。請在使用條款閱讀更多資訊。