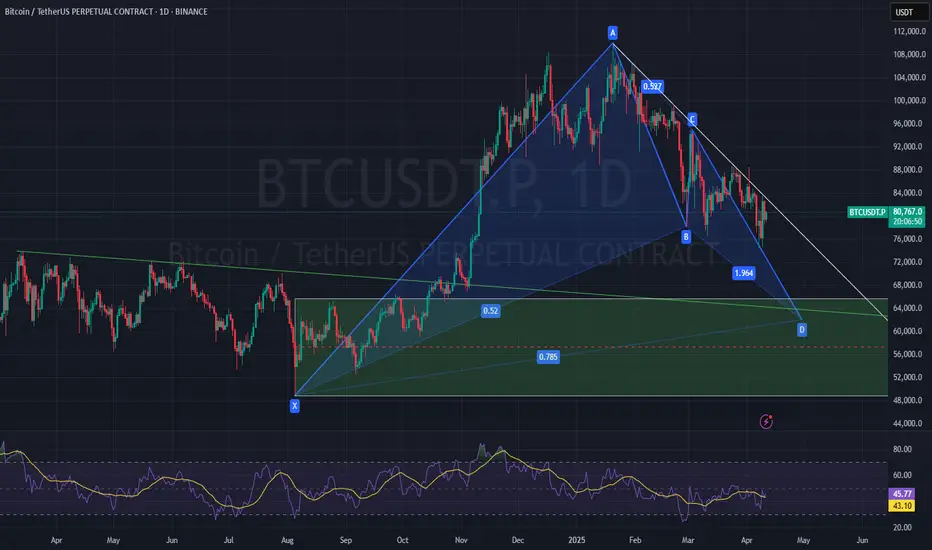
BTCUSD – Bullish Gartley Pattern Forming
✅ Market Context:
Pattern: Bullish Gartley
Current Trend: Mid-term bearish
Key Bullish Level: $62,000 (Potential PRZ – bullish reversal zone)
Resistance: Long-standing bearish trendline, tested multiple times
Support: Bullish trendline aligning near the Gartley PRZ at $62,000
🧩 Gartley Breakdown:
XA: Strong bullish move
AB: Retraces 61.8% of XA
BC: Retraces 38.2–88.6% of AB
CD: Extends to 78.6% of XA
→ Completion zone at $62,000
📈 Trade Idea – Prepare for LONG Setup
Scenario 1: Price Drops to $62,000
Look for bullish confirmation (candle pattern, divergence)
Ideal entry zone to long from PRZ
Stop-loss: Below Gartley X-point or local low (~$60,500–$61,000)
Scenario 2: Price Consolidates Under Trendline
If it breaks the bearish trendline, prepare for early momentum breakout
Wait for a retest of the breakout and enter
Targets:
TP1: $65,500 (structure)
TP2: $68,000 (Fibonacci 0.618)
TP3: $70,000+
Risk-Reward: Aim for 1:2 or higher
⚠️ What to Watch:
Daily RSI/MACD for divergence confirmation
BTC volume confirmation near $62,000
Macro news: BTC ETF flows, Fed stance on rates, CPI
免責聲明
這些資訊和出版物並不意味著也不構成TradingView提供或認可的金融、投資、交易或其他類型的意見或建議。請在使用條款閱讀更多資訊。