👋 Welcome to TradeCity Pro!
Let’s go over the Bitcoin analysis and key crypto indices. As usual, I’ll be reviewing the triggers for the New York futures session.
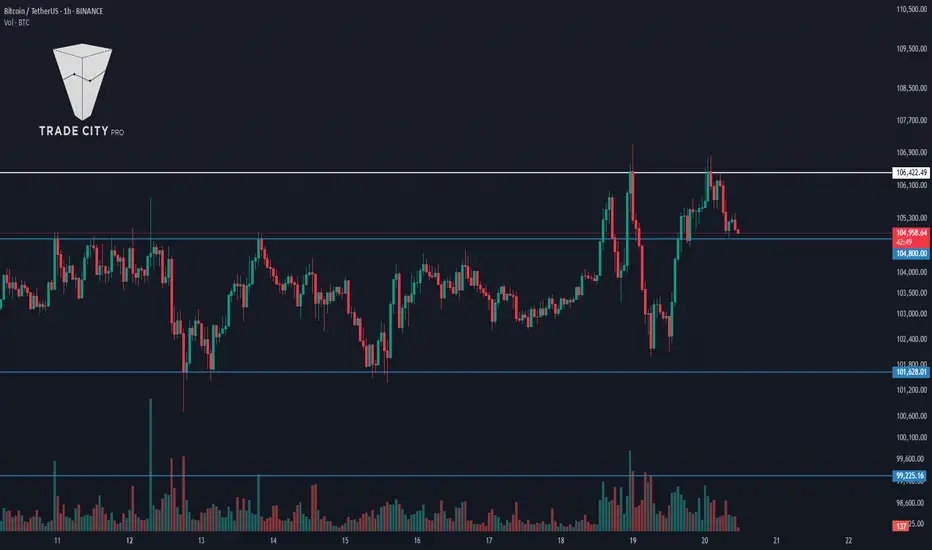
⏳ 1-Hour Timeframe
As you can see, a Double Bottom pattern activated yesterday, and the price has returned to the 106422 zone.
✔️ We previously had a support at 102882, but since the price wasn’t respecting it consistently, I’ve removed it. If price shows solid support there again, I’ll reintroduce the level.
🔍 Currently, the first trigger for a long position is 106422. This is a highly critical level and represents the main resistance for Bitcoin. If it breaks, there’s a strong chance for a sharp upward move.
✨ The first support in the way is 104800, which isn’t very strong. If a correction occurs, this level is likely to break. The main support remains at 101628.
📈 A break below 101628 would confirm a bearish reversal, and we could even consider opening a short position. The next support below that would be at 99225.
📊 Market volume has significantly increased over the past few days. This spike in volume suggests that a sharp move is likely. Using our trigger levels, we’ll be able to determine whether it’s an upward or downward breakout.

👑 BTC.D Analysis
Bitcoin dominance is still below the 64.04 zone and appears to be consolidating.
💥 The 64.04 level is highly sensitive. A breakout would signal a bullish shift in dominance, while a rejection would suggest the downtrend will resume.
⚡️ We’ll get confirmation of further downside if 63.71 breaks. Below that, the next support levels are at 63.30 and 62.65.

📅 Total2 Analysis
Yesterday, Total2 reacted to the 1.16 support and moved upward to 1.20.
💫 A break above 1.20 today would confirm bullish continuation. A drop below 1.16, however, would confirm the continuation of a broader correction.

📅 USDT.D Analysis
Yesterday, the 4.70 level was faked out, and the chart fell back into the range box.
🎲 I believe the chances of breaking below the range bottom have increased. Key bearish triggers are at 4.57 and 4.51. On the flip side, another break above 4.70 would confirm renewed bullish momentum for USDT dominance.
❌ Disclaimer ❌
Trading futures is highly risky and dangerous. If you're not an expert, these triggers may not be suitable for you. You should first learn risk and capital management. You can also use the educational content from this channel.
Finally, these triggers reflect my personal opinions on price action, and the market may move completely against this analysis. So, do your own research before opening any position.
Let’s go over the Bitcoin analysis and key crypto indices. As usual, I’ll be reviewing the triggers for the New York futures session.
⏳ 1-Hour Timeframe
As you can see, a Double Bottom pattern activated yesterday, and the price has returned to the 106422 zone.
✔️ We previously had a support at 102882, but since the price wasn’t respecting it consistently, I’ve removed it. If price shows solid support there again, I’ll reintroduce the level.
🔍 Currently, the first trigger for a long position is 106422. This is a highly critical level and represents the main resistance for Bitcoin. If it breaks, there’s a strong chance for a sharp upward move.
✨ The first support in the way is 104800, which isn’t very strong. If a correction occurs, this level is likely to break. The main support remains at 101628.
📈 A break below 101628 would confirm a bearish reversal, and we could even consider opening a short position. The next support below that would be at 99225.
📊 Market volume has significantly increased over the past few days. This spike in volume suggests that a sharp move is likely. Using our trigger levels, we’ll be able to determine whether it’s an upward or downward breakout.
👑 BTC.D Analysis
Bitcoin dominance is still below the 64.04 zone and appears to be consolidating.
💥 The 64.04 level is highly sensitive. A breakout would signal a bullish shift in dominance, while a rejection would suggest the downtrend will resume.
⚡️ We’ll get confirmation of further downside if 63.71 breaks. Below that, the next support levels are at 63.30 and 62.65.
📅 Total2 Analysis
Yesterday, Total2 reacted to the 1.16 support and moved upward to 1.20.
💫 A break above 1.20 today would confirm bullish continuation. A drop below 1.16, however, would confirm the continuation of a broader correction.
📅 USDT.D Analysis
Yesterday, the 4.70 level was faked out, and the chart fell back into the range box.
🎲 I believe the chances of breaking below the range bottom have increased. Key bearish triggers are at 4.57 and 4.51. On the flip side, another break above 4.70 would confirm renewed bullish momentum for USDT dominance.
❌ Disclaimer ❌
Trading futures is highly risky and dangerous. If you're not an expert, these triggers may not be suitable for you. You should first learn risk and capital management. You can also use the educational content from this channel.
Finally, these triggers reflect my personal opinions on price action, and the market may move completely against this analysis. So, do your own research before opening any position.
💥 Don’t Miss Out!
🏆 Best Crypto Exchange: bitunix.com/register?vipCode=TCPINT
💰 Join the Telegram Channel Now: t.me/Tradecityproint
🤵 Business Contact: Tradecityproteam@gmail.com
🏆 Best Crypto Exchange: bitunix.com/register?vipCode=TCPINT
💰 Join the Telegram Channel Now: t.me/Tradecityproint
🤵 Business Contact: Tradecityproteam@gmail.com
相關出版品
免責聲明
這些資訊和出版物並不意味著也不構成TradingView提供或認可的金融、投資、交易或其他類型的意見或建議。請在使用條款閱讀更多資訊。