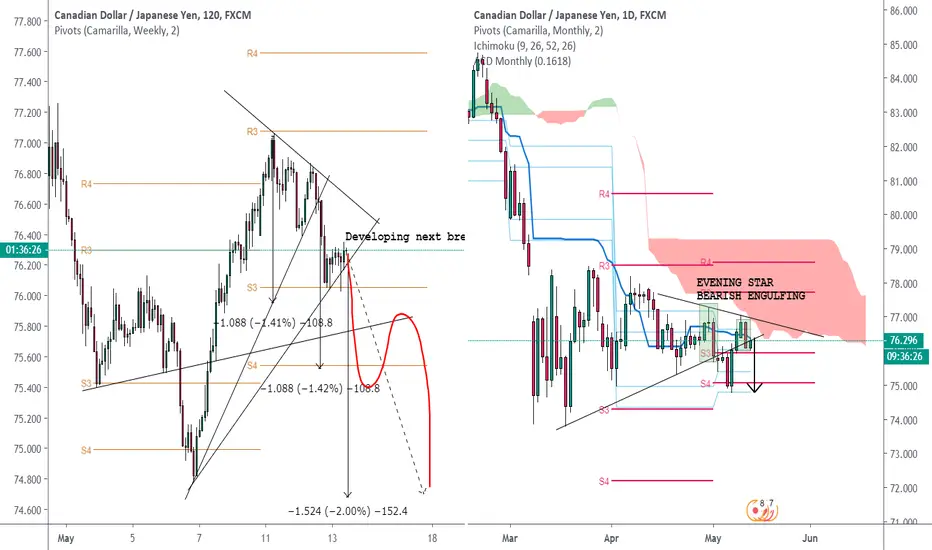
This thing corresponds to textbook bump and run reversal chart pattern. We are in heavy bearish zone, below yearly floor. Kumo cloud is thick, daily kijun has bearish slope.
We had 30 percent lead in phase A line, 46 degrees B line. Now it should be a minor pullback. Major pullback will be after breaking A line. After the big pullback we should have nearly vertical run phase. DM projections confirm the pattern. Stop above bearish engulfing.
The previous failed breakdown candle with long shadow is of some concern of course. But bears are strong by holding to the front line (time factor). Because of that I would enter with a breakdown candle on 1-2 hrs (it should not have any long rejection shadow). Pre breakdown candle should be green.
For educational purposes only.
註釋
Bearish engulfing candle actually broke the bullish trend on daily already.免責聲明
這些資訊和出版物並不意味著也不構成TradingView提供或認可的金融、投資、交易或其他類型的意見或建議。請在使用條款閱讀更多資訊。