🚀 Breakout Stock Alert: Camlin Fine Sciences Ltd (CAMLINFINE)
📌 Price: ₹179.00 📊 Volume: 2.91M 📅 Date: 13-05-2025
① Pattern Name, Timeframe, Structure & Explanation
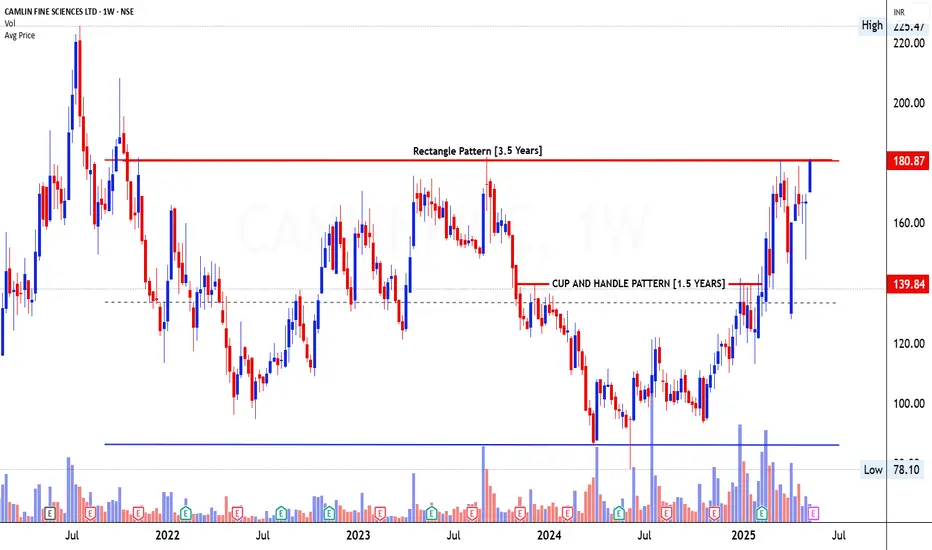
Rectangle Pattern (3.5 Years) on Weekly Chart
The stock of Camlin Fine Sciences Ltd has been coiling inside a broad Rectangle Pattern for over 3.5 years, bounded by a solid support near ₹78 and resistance near ₹181. This long consolidation phase indicates prolonged accumulation, marked by multiple failed attempts to cross the ₹180 zone, creating a horizontal ceiling.
Price behavior has been extremely constructive:
* Compression near the resistance zone signals absorption of supply
* The stock is now testing the upper resistance of ₹180.87 with strength
② Volume Formation (During Pattern, Breakout, and Retest)
* Volume dried up during the handle phase, confirming lack of aggressive selling
* Breakout rally saw multiple weekly spikes in volume, particularly near ₹140 and again as price approached ₹180
* Volume this week stands at 2.91M, above the 20-week average (approx. 2M), indicating accumulation by smart money
* Volume clusters on rallies and fades on corrections = institutional footprint
③ Breakout Candlestick, Follow-Through & Trap Behavior
* The breakout candle is a strong full-bodied bullish bar, closing near high of week, with no upper wick — a sign of conviction
* Previous week was an inside bar showing hesitation, but no breakdown, which has now been invalidated
* No visible trap or shakeout on breakout — the trap happened earlier in the handle dip around ₹130-140, where weak hands were shaken out
* Clean follow-through over past 3 weeks with higher closes
④ Trade Explanation (Entry, Target, Stop-loss, Risk\:Reward)
* Entry Zone: ₹180–183 (Breakout zone)
* Stop-loss: ₹139 (Base of handle and prior breakout resistance)
* Target Zone: ₹250–265 (Measured move from rectangle height: ₹180–₹78 = ₹102. Add ₹102 to breakout = ₹282 max potential. Conservatively ₹250–265)
* Risk\:Reward: Approx 1:2.5+
→ Risk: ₹40, Reward: ₹70–85
The breakout from a multi-year range, backed by strong volume and constructive price action, gives high conviction. Ideal for positional swing traders.
📌 Price: ₹179.00 📊 Volume: 2.91M 📅 Date: 13-05-2025
① Pattern Name, Timeframe, Structure & Explanation
Rectangle Pattern (3.5 Years) on Weekly Chart
The stock of Camlin Fine Sciences Ltd has been coiling inside a broad Rectangle Pattern for over 3.5 years, bounded by a solid support near ₹78 and resistance near ₹181. This long consolidation phase indicates prolonged accumulation, marked by multiple failed attempts to cross the ₹180 zone, creating a horizontal ceiling.
Price behavior has been extremely constructive:
* Compression near the resistance zone signals absorption of supply
* The stock is now testing the upper resistance of ₹180.87 with strength
② Volume Formation (During Pattern, Breakout, and Retest)
* Volume dried up during the handle phase, confirming lack of aggressive selling
* Breakout rally saw multiple weekly spikes in volume, particularly near ₹140 and again as price approached ₹180
* Volume this week stands at 2.91M, above the 20-week average (approx. 2M), indicating accumulation by smart money
* Volume clusters on rallies and fades on corrections = institutional footprint
③ Breakout Candlestick, Follow-Through & Trap Behavior
* The breakout candle is a strong full-bodied bullish bar, closing near high of week, with no upper wick — a sign of conviction
* Previous week was an inside bar showing hesitation, but no breakdown, which has now been invalidated
* No visible trap or shakeout on breakout — the trap happened earlier in the handle dip around ₹130-140, where weak hands were shaken out
* Clean follow-through over past 3 weeks with higher closes
④ Trade Explanation (Entry, Target, Stop-loss, Risk\:Reward)
* Entry Zone: ₹180–183 (Breakout zone)
* Stop-loss: ₹139 (Base of handle and prior breakout resistance)
* Target Zone: ₹250–265 (Measured move from rectangle height: ₹180–₹78 = ₹102. Add ₹102 to breakout = ₹282 max potential. Conservatively ₹250–265)
* Risk\:Reward: Approx 1:2.5+
→ Risk: ₹40, Reward: ₹70–85
The breakout from a multi-year range, backed by strong volume and constructive price action, gives high conviction. Ideal for positional swing traders.
Learn Today for Better Tomorrow
免責聲明
這些資訊和出版物並非旨在提供,也不構成TradingView提供或認可的任何形式的財務、投資、交易或其他類型的建議或推薦。請閱讀使用條款以了解更多資訊。
Learn Today for Better Tomorrow
免責聲明
這些資訊和出版物並非旨在提供,也不構成TradingView提供或認可的任何形式的財務、投資、交易或其他類型的建議或推薦。請閱讀使用條款以了解更多資訊。