### **Step 1: Entry**
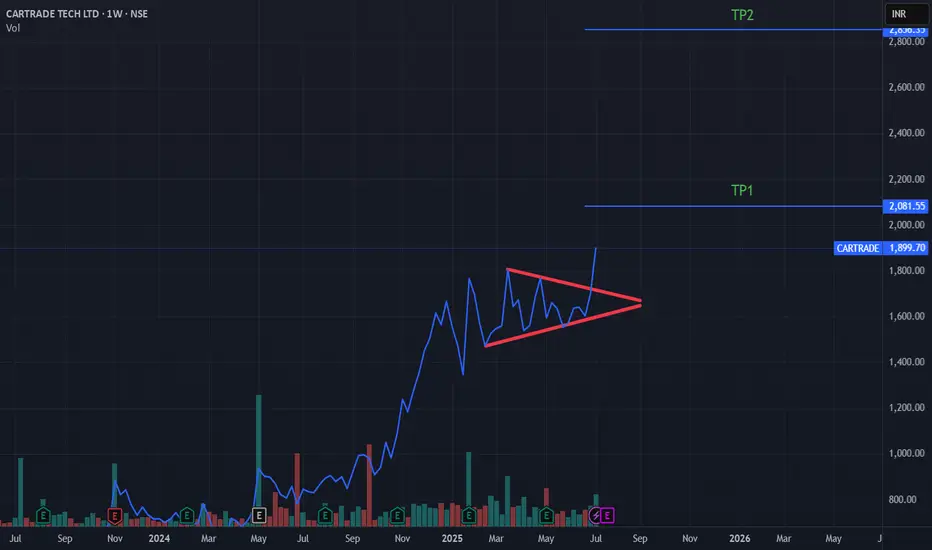
The chart shows a bullish breakout from a symmetrical triangle pattern. The entry signal was triggered when the price decisively closed above the upper trendline of this triangle. An entry can be considered around the current price of **₹1,899.70** or on a potential retest of the breakout zone (approximately ₹1,750 - ₹1,800).
### **Step 2: Stop Loss**
To manage risk, a stop loss should be placed below a key support level. A logical placement would be below the lower trendline of the triangle pattern to protect against a failed breakout. A suitable stop loss could be set near **₹1,600**.
### **Step 3: Take Profit**
The chart has two pre-defined targets based on the breakout's momentum:
* **Target 1 (TP1):** ₹2,081.55
* **Target 2 (TP2):** ₹2,856.35
You could consider booking partial profits at TP1 and trailing the stop loss for the remaining position towards TP2.
免責聲明
這些資訊和出版物並不意味著也不構成TradingView提供或認可的金融、投資、交易或其他類型的意見或建議。請在使用條款閱讀更多資訊。
免責聲明
這些資訊和出版物並不意味著也不構成TradingView提供或認可的金融、投資、交易或其他類型的意見或建議。請在使用條款閱讀更多資訊。