📊 Current Context
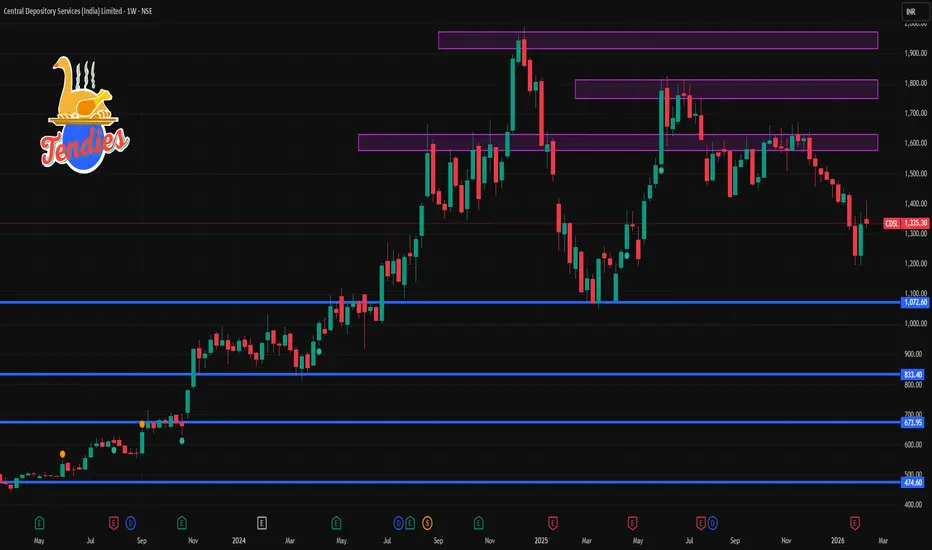
Latest NSE price around ₹1,330–₹1,350 range.
🔁 Weekly Technical Levels (Pivot-Derived)
(These are commonly used ranges on weekly charts to identify trend zones)
📌 Key Weekly Support Levels
Primary Support (S1): ~₹1,370–₹1,380 – initial downside pivot support (weekly).
Additional Support Zone: ~₹1,350–₹1,370 – deeper support cluster zone if breaking lower.
Deeper Bearish Support: ₹~1,300 region (below current range) — psychological zone from chart structure and longer cycles.
📌 Key Weekly Resistance Levels
Weekly Resistance (R1): ~₹1,475–₹1,528 – immediate weekly resistance zone.
Secondary Resistance: ~₹1,550–₹1,580+ — broader resistance from recent highs.
Higher Upside Zone: ~₹1,630–₹1,830 — major supply zone (longer-term weekly resistance area).
👉 Pivot Mid-Point: ~₹1,475 serves as a key weekly pivot; above this suggests more bullish weekly bias, while below indicates continuation of short-term corrective pressure.
📉 Weekly Market Structure (Technical Sentiment)
Weekly technical readings from chart ideas suggest bearish bias on weekly timeframe unless key resistances are broken.
Holding above ~₹1,370 can help maintain some support; failure could invite deeper pullbacks.
Break and hold above ~₹1,475–₹1,528 may realign short-term weekly trend towards neutral/bullish.
🧠 Notes for Weekly Decisions
Trend bias: The weekly chart is showing pressure below mid-pivot area (~₹1,475).
Support focus: Strong attention around ~₹1,370 and then psychological lower levels.
Resistance focus: Most important upside hurdles ~₹1,475–₹1,528; above that next cluster ~₹1,550+.
Volume, macro trend, and NSE broader trend also influence the weekly structure.
⚠️ This is not investment advice — technical levels are for monitoring trends and possible reactions on weekly charts, and actual price can vary with market conditions.
相關出版品
免責聲明
這些資訊和出版物並非旨在提供,也不構成TradingView提供或認可的任何形式的財務、投資、交易或其他類型的建議或推薦。請閱讀使用條款以了解更多資訊。