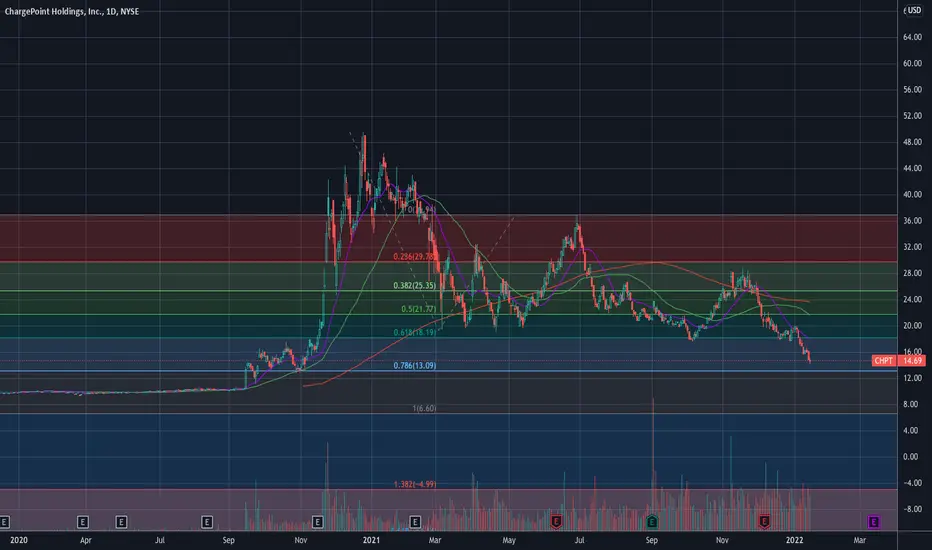
The price has been in decline and RSI just entered into the oversold territory. Can it find some relieve from selling pressure?
My guess is that it will go to $13 which is the next support. If $13 fails, $10.50 could happen.
Watching from side lines until clear reversal or bottom is found.
———————————————————
How to read my charts?
- Matching color trend lines shows the pattern. Sometimes a chart can have multiple patterns. Each pattern will have matching color trend lines.
- The yellow horizontal lines shows support and resistance areas.
- Fib lines also shows support and resistance areas.
- The dotted white lines shows price projection for breakout or breakdown target.
Disclaimer: Do your own DD. Not an investment advice.
I am not a licensed professional. None of the posts that I published are investment advice. Do your own research.
免責聲明
這些資訊和出版物並不意味著也不構成TradingView提供或認可的金融、投資、交易或其他類型的意見或建議。請在使用條款閱讀更多資訊。
I am not a licensed professional. None of the posts that I published are investment advice. Do your own research.
免責聲明
這些資訊和出版物並不意味著也不構成TradingView提供或認可的金融、投資、交易或其他類型的意見或建議。請在使用條款閱讀更多資訊。