The weekly chart of CL shows a divergence of MACD lines and sort of a divergence of the histogram. Both Force Indexes are lower than they were at the last swing high. 
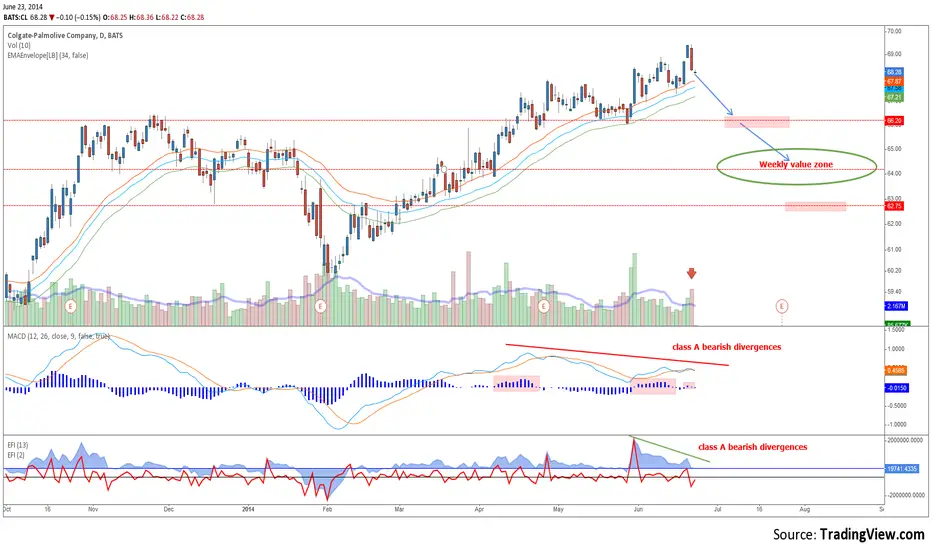
The daily chart has a closing marubozu candle, which might signal the start of the correction, note also the high volume. MACD lines and histogram show a class A bearish divergence, and so do both Force Indexes. First support comes at 66$. There is good support at 64$, where the weekly Wave stands approximately. That will be a level to watch closely if this correction is coming
The daily chart has a closing marubozu candle, which might signal the start of the correction, note also the high volume. MACD lines and histogram show a class A bearish divergence, and so do both Force Indexes. First support comes at 66$. There is good support at 64$, where the weekly Wave stands approximately. That will be a level to watch closely if this correction is coming
免責聲明
這些資訊和出版物並非旨在提供,也不構成TradingView提供或認可的任何形式的財務、投資、交易或其他類型的建議或推薦。請閱讀使用條款以了解更多資訊。
免責聲明
這些資訊和出版物並非旨在提供,也不構成TradingView提供或認可的任何形式的財務、投資、交易或其他類型的建議或推薦。請閱讀使用條款以了解更多資訊。