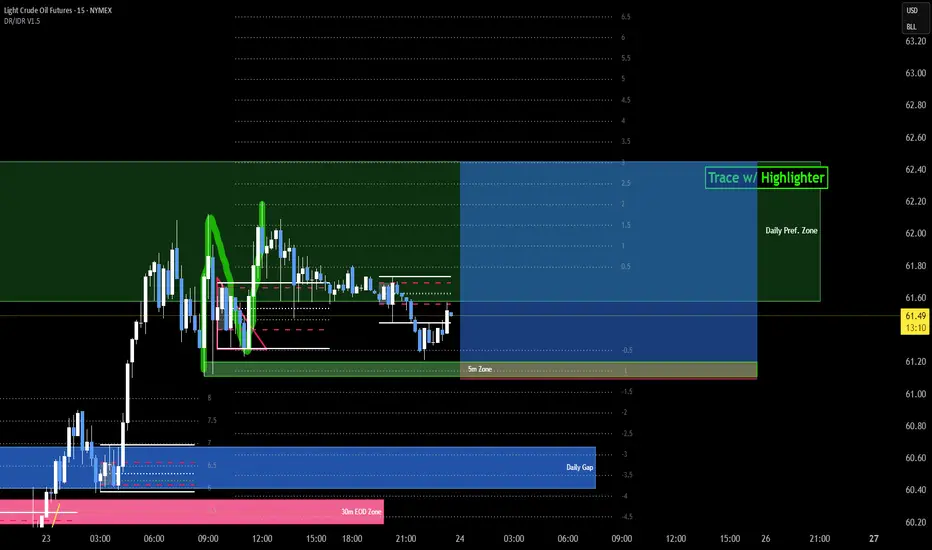
Important to Highlight the price action to show where exactly the new high is (tp), where is the liquidity that should be just above the zone, and the source of the move (the zone using the 5 minute chart).
I look for the last "doji" before the move that closed in the opposite direction.
So, in this idea, the zone is based on the last down doji candle before the up move.
And for longs, I mark the zone starting at the Open of the doji candle and down to the lowest point of that doji wick.
I look for the last "doji" before the move that closed in the opposite direction.
So, in this idea, the zone is based on the last down doji candle before the up move.
And for longs, I mark the zone starting at the Open of the doji candle and down to the lowest point of that doji wick.
免責聲明
這些資訊和出版物並不意味著也不構成TradingView提供或認可的金融、投資、交易或其他類型的意見或建議。請在使用條款閱讀更多資訊。
免責聲明
這些資訊和出版物並不意味著也不構成TradingView提供或認可的金融、投資、交易或其他類型的意見或建議。請在使用條款閱讀更多資訊。