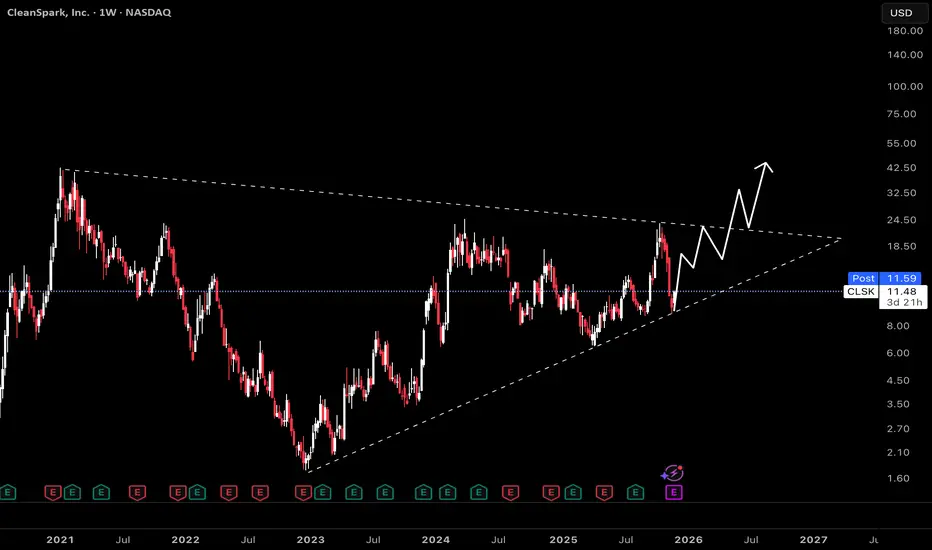
This weekly chart tracks CleanSpark, revealing an extended symmetrical triangle formation that has dictated price action since mid-2021. Symmetrical triangles often signal a period of compression in volatility, building up for a breakout as price coils between support and resistance trendlines.
Triangles like this signal indecision, as neither bulls nor bears have established control. The energy stored within the pattern typically results in a significant move once a breakout occurs.
Given the recent bounce off ascending support and renewed momentum, the most plausible scenario is a bullish breakout.
For a short-term opportunity, the upper resistance of the triangle offers a plausible setup for a countertrend trade. If price rallies toward the triangle's descending resistance and stalls, a short position could be initiated with tight risk management. The idea is to sell CLSK at resistance, anticipating that price may be rejected and revert lower within the triangle until a confirmed breakout occurs.
免責聲明
這些資訊和出版物並非旨在提供,也不構成TradingView提供或認可的任何形式的財務、投資、交易或其他類型的建議或推薦。請閱讀使用條款以了解更多資訊。
免責聲明
這些資訊和出版物並非旨在提供,也不構成TradingView提供或認可的任何形式的財務、投資、交易或其他類型的建議或推薦。請閱讀使用條款以了解更多資訊。