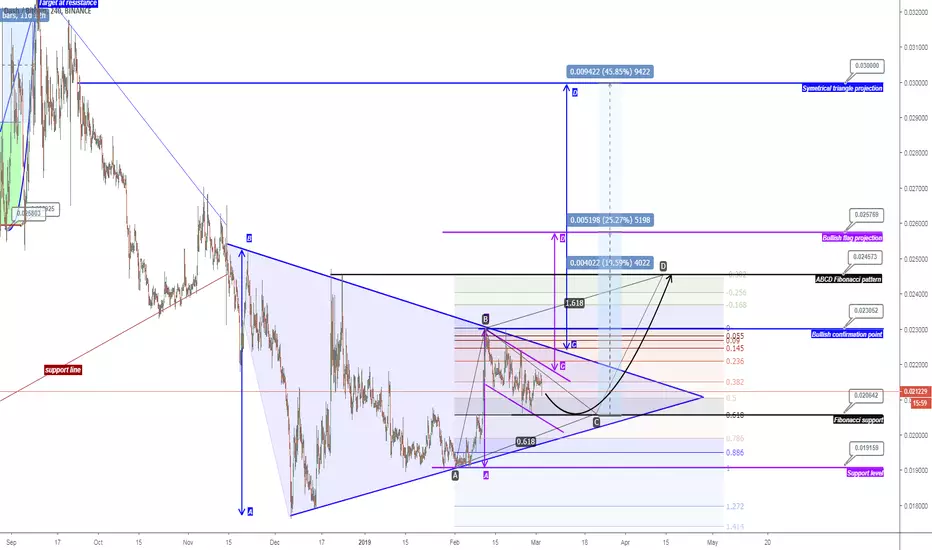
We have 3 pattern perform at DASH, and all of them have different target.
1. ABCD Fibonacci pattern (black colour)
this pattern start from February and have fibonacci support at 0.02642 as buying point, and set target at 0.024573 with 19% profit projection.
2. Bullish flag (purple)
This coin also perform bullish flag pattern with 25% profit projection at 0.025769
3. Symetrical triangle (blue)
last pattern we have is symetrical triangle.
This is long term projection with 45% profit target at 0.03000
NOte :
1. All this pattern will failed if 0.019159 break down
2. To confirm bullish continue, we need 1 candle full break up bullish confirmation point at 0.023052
3. buy at very low price this week at 0.020642
Good luck
免責聲明
這些資訊和出版物並不意味著也不構成TradingView提供或認可的金融、投資、交易或其他類型的意見或建議。請在使用條款閱讀更多資訊。