Despite the strong quarterly results, the stock was penalized due to a lower outlook for Q2, a consequence of uncertainties surrounding tariffs, leading to a 20% decline.
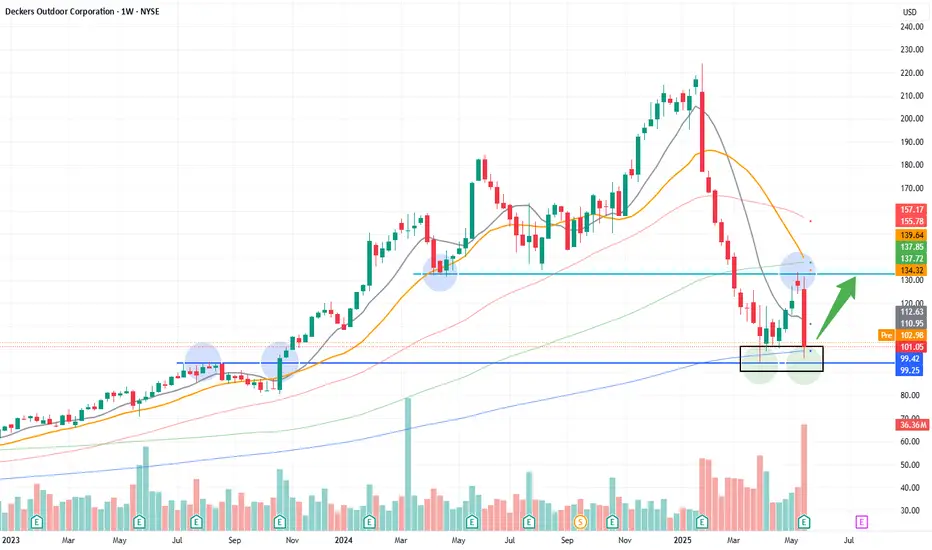
The price is reaching the weekly 200-day simple moving average (blue line) for the second time, coinciding with a long-term support level (also marked in blue), initiating the formation of a double bottom pattern.
The first target is the light blue resistance area around $130 (+30%), where a potential confirmation of the double bottom could occur with a breakout of the neckline, followed by a further 25–30% increase
註釋
Strong weekly sma200 (blu line) support!註釋
Double bottom by the way, first target 132$ (neckline)免責聲明
這些資訊和出版物並不意味著也不構成TradingView提供或認可的金融、投資、交易或其他類型的意見或建議。請在使用條款閱讀更多資訊。