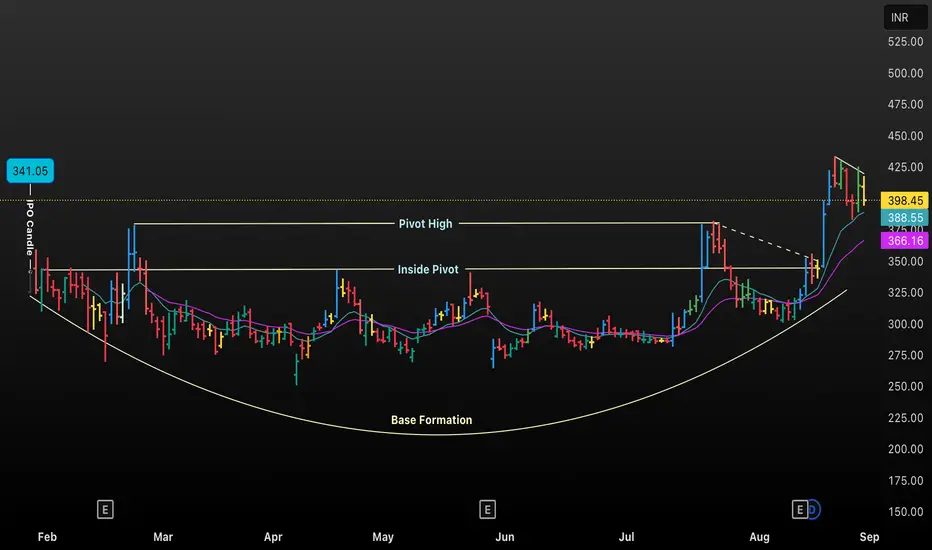
The chart displays the daily price candles for DENTA, highlighting key technical levels: the Pivot High, Inside Pivot, and the rounded Base Formation that characterizes a classic Cup and Handle chart pattern. The IPO Candle signifies the initial price action post-listing. As prices gradually form a rounded bottom, accumulation occurs, followed by an upward breakout above the resistance (Pivot High), indicating bullish momentum. The colored moving averages provide additional context for trend strength and potential support levels.
免責聲明
這些資訊和出版物並非旨在提供,也不構成TradingView提供或認可的任何形式的財務、投資、交易或其他類型的建議或推薦。請閱讀使用條款以了解更多資訊。
免責聲明
這些資訊和出版物並非旨在提供,也不構成TradingView提供或認可的任何形式的財務、投資、交易或其他類型的建議或推薦。請閱讀使用條款以了解更多資訊。