Topic Statement:
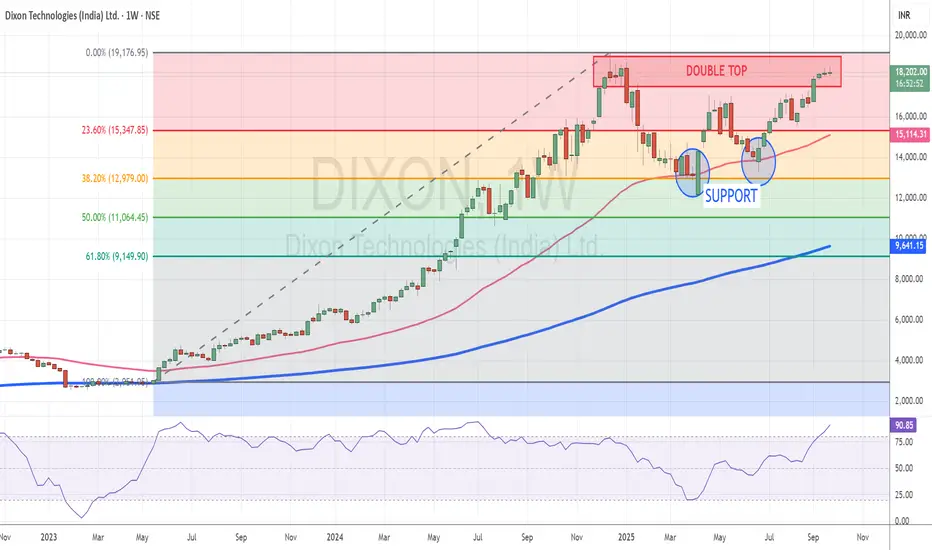
Dixon has rebounded strongly in line with the broader market rally but now approaches critical resistance levels that may cap further upside.
Key Points:
1. The stock retraced to the 38.2% Fibonacci level where it found strong support and resumed its upward move
2. The 50-day EMA acted as a deflection point, offering additional support during the recovery
3. Price is now at its lifetime high near the 18,000 mark, where a double top candlestick pattern is forming
4. The double top indicates significant resistance, making it a potential shorting opportunity unless a breakout confirms further bullishness
免責聲明
這些資訊和出版物並非旨在提供,也不構成TradingView提供或認可的任何形式的財務、投資、交易或其他類型的建議或推薦。請閱讀使用條款以了解更多資訊。