I’ve been tracking 
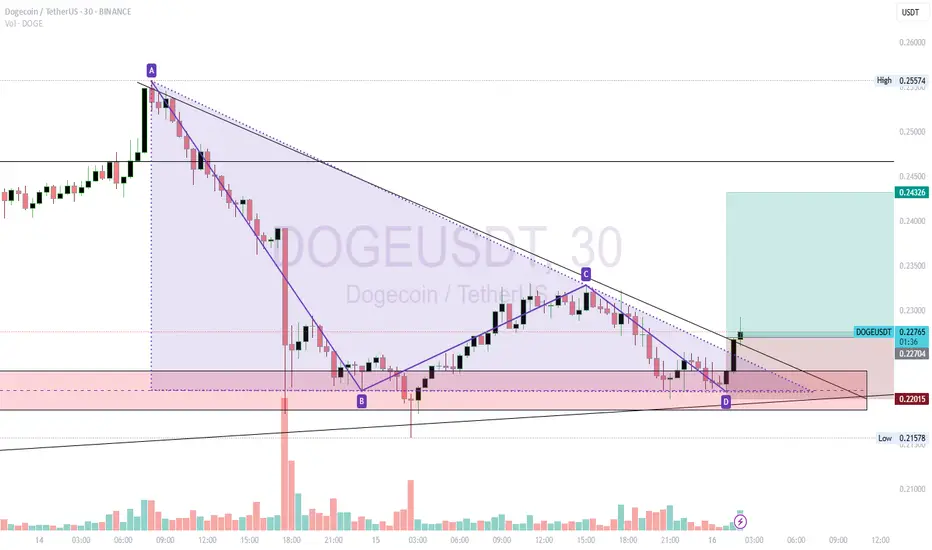
 DOGEUSDT on the 30m chart using an ABCD point layout to outline a descending triangle pattern.
A → C → D: Lower highs consistently respecting the downtrend line.
B & D zone (~0.2200): Flat base support forming the triangle floor.
Price has now broken above the descending trendline with a noticeable spike in volume, indicating that buyers stepped in aggressively to break the pattern.
Why This Matters:
Volume was relatively muted during the consolidation phase inside the triangle, which is normal for this type of setup. However, at the breakout candle, volume surged — confirming that the move was not just a false breakout but backed by real market participation.
Trade Plan:
Entry Zone: Above 0.2270 (confirmed breakout)
First Target: 0.2300
Second Target: 0.2430 (measured move from triangle height)
Stop Loss: Below 0.2200 (pattern invalidation)
Notes:
While descending triangles often break downward, this setup shows bullish divergence between price action and volume — suggesting that the market may be preparing for a sustained upside move.
免責聲明
這些資訊和出版物並非旨在提供,也不構成TradingView提供或認可的任何形式的財務、投資、交易或其他類型的建議或推薦。請閱讀使用條款以了解更多資訊。
免責聲明
這些資訊和出版物並非旨在提供,也不構成TradingView提供或認可的任何形式的財務、投資、交易或其他類型的建議或推薦。請閱讀使用條款以了解更多資訊。