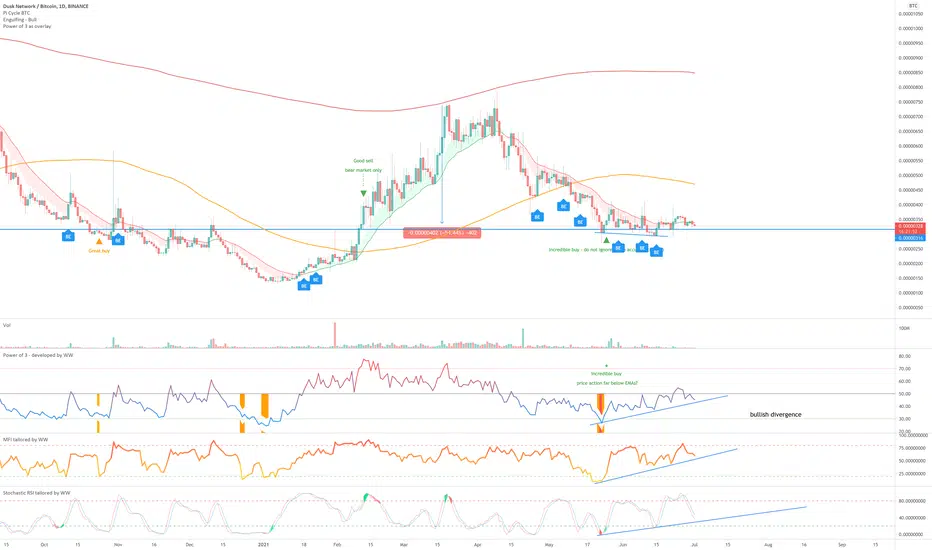
On the above 1-day chart price action has corrected 50% since mid-March with a oversold condition (orange column). A ‘incredible buy’ condition now exists following the regular bullish divergence between price action and all oscillators. Perfect.
On the 3-day chart (below) price action is printing bullish engulfing candles on past resistance as Stochastic RSI crossed up 20.
Is it possible price action falls further? Sure.
Is it probable? Unlikely, strong probability of upside move.
1st target 600 sats.

On the 3-day chart (below) price action is printing bullish engulfing candles on past resistance as Stochastic RSI crossed up 20.
Is it possible price action falls further? Sure.
Is it probable? Unlikely, strong probability of upside move.
1st target 600 sats.
交易進行
交易進行
RSI crosses 50 following a break of past resistance. A rotation back into BTC is projected around mid-late September.交易進行
2nd 'incredible buy' signal + bullish divergence between price action and the oscillators.交易進行
註釋
'great sell' alert 免責聲明
這些資訊和出版物並不意味著也不構成TradingView提供或認可的金融、投資、交易或其他類型的意見或建議。請在使用條款閱讀更多資訊。
免責聲明
這些資訊和出版物並不意味著也不構成TradingView提供或認可的金融、投資、交易或其他類型的意見或建議。請在使用條款閱讀更多資訊。