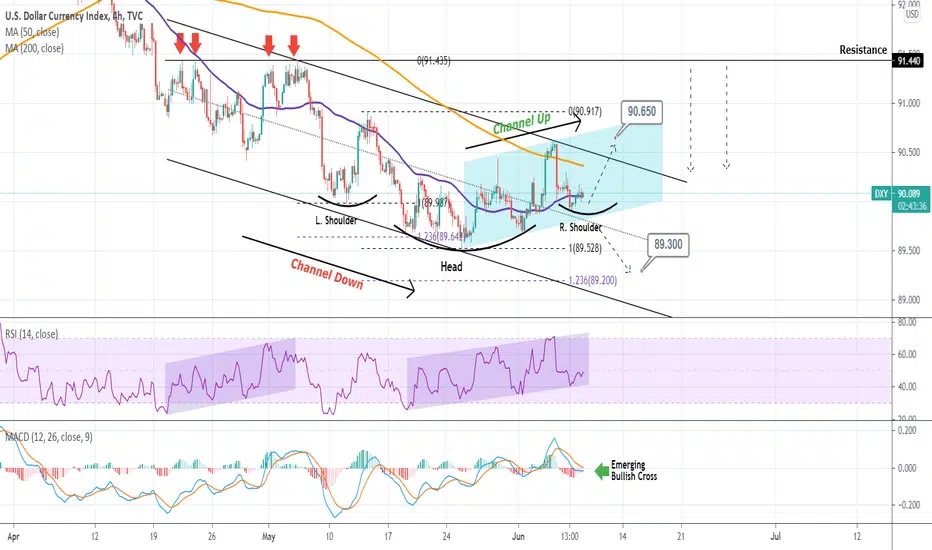
DXY has been bearish since the March 31 top and after the multiple rejections on the 91.440 Resistance, formed a Channel Down. Since May 11 though an Inverse Head and Shoulders pattern slowly emerged, which is technically a pattern seen on market bottoms that prepares a reversal. In turn, that gave way to a Channel Up since May 25 (blue channel). My trading plan is this:
* As long as the Channel Up holds, long to 90.650 (the Higher Highs of the Channel). If the Channel Down breaks, short to 89.300 (the 1.236 Fibonacci extension). If the Channel Up continues above the target, medium-term short near the 91.440. The trend remains bearish long-term, unless that Resistance level breaks.
** Please support this idea with your likes and comments, it is the best way to keep it relevant and support me. **
--------------------------------------------------------------------------------------------------------
!! Donations via TradingView coins also help me a great deal at posting more free trading content and signals here !!
🎉 👍 Shout-out to TradingShot's 💰 top TradingView Coin donor 💰 this week ==> CryptoSurfer007
--------------------------------------------------------------------------------------------------------
👑Best Signals (Forex/Crypto+70% accuracy) & Account Management (+20% profit/month on 10k accounts)
💰Free Channel t.me/tradingshotglobal
🤵Contact info@tradingshot.com t.me/tradingshot
🔥New service: next X100 crypto GEMS!
💰Free Channel t.me/tradingshotglobal
🤵Contact info@tradingshot.com t.me/tradingshot
🔥New service: next X100 crypto GEMS!
免責聲明
這些資訊和出版物並非旨在提供,也不構成TradingView提供或認可的任何形式的財務、投資、交易或其他類型的建議或推薦。請閱讀使用條款以了解更多資訊。