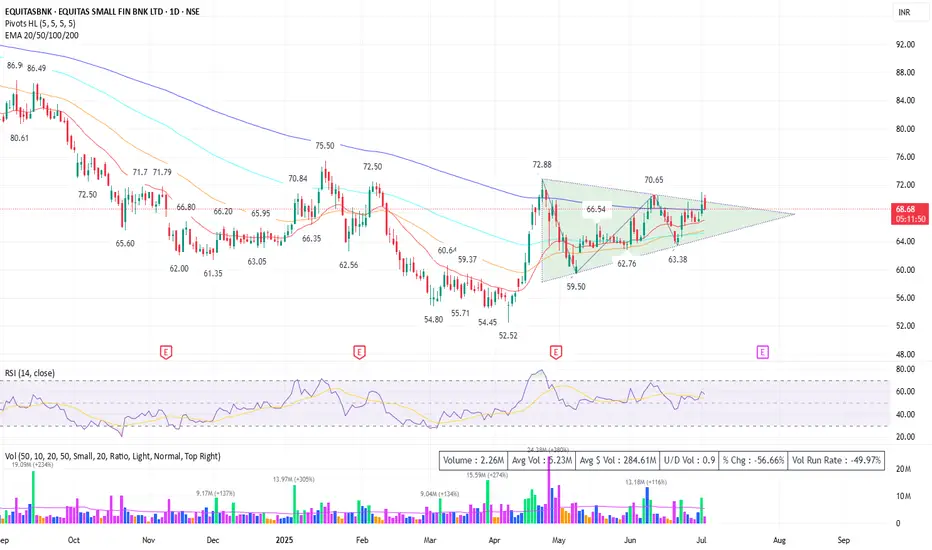
📈 EQUITASBNK – Symmetrical Triangle Breakout Setup | Swing Trade Opportunity 🛠️
Equitas Small Finance Bank (EQUITASBNK) is forming a classic Symmetrical Triangle pattern on the Daily chart, indicating potential breakout momentum. Price is consolidating within a tightening range and recently attempted a breakout near ₹70 before pulling back slightly.
• Chart Pattern: Symmetrical Triangle – converging trendlines since April 2025.
• Support Zones: ₹66.50, ₹63.30 (swing low), and ₹62.76 (triangle base).
• Resistance Zones: ₹70.65 (recent swing high), ₹72.88 (previous top), ₹75.50 (pattern target).
• Moving Averages:
- EMA 20 = ₹66.56
- EMA 50 = ₹65.06
- EMA 200 = ₹68.50 (recently tested)
• RSI (14): 57.22 – Neutral bullish zone, not overbought.
• Volume: Breakout attempt saw increasing volume, followed by low-volume pullback – indicating strength.
> With the price retesting the upper triangle boundary and sitting above key moving averages, a breakout above ₹70.65 could initiate a strong bullish move. Watch for volume confirmation and RSI push above 60 for added strength.
🎯 Trade Plan:
• Entry (Aggressive): ₹68.5–₹69 on retest support.
• Entry (Confirmation): Above ₹70.65 with closing + volume > 2.5M.
• Stop Loss: Below ₹66.00 (EMA confluence + trendline support).
• Targets:
- T1: ₹72.80
- T2: ₹75.50
- T3 (Extended): ₹78.00 (measured move from triangle)
• Risk-Reward: Approx. 1:2.5 to 1:3
⚠️ Disclaimer:
This is a technical view for educational purposes only. Please do your own research or consult your financial advisor before acting on this idea.
免責聲明
這些資訊和出版物並不意味著也不構成TradingView提供或認可的金融、投資、交易或其他類型的意見或建議。請在使用條款閱讀更多資訊。
免責聲明
這些資訊和出版物並不意味著也不構成TradingView提供或認可的金融、投資、交易或其他類型的意見或建議。請在使用條款閱讀更多資訊。
