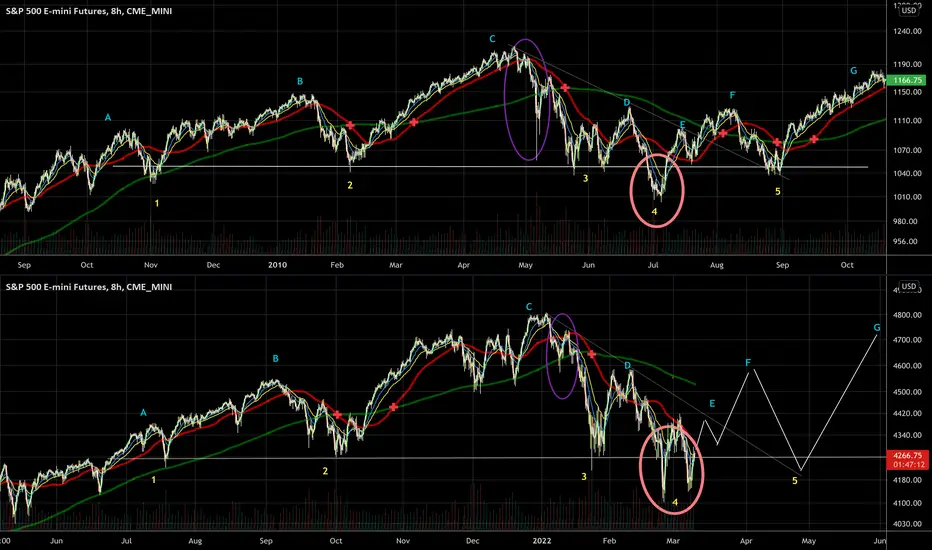
Mirroring the correction of 2010. The structure is almost similar with minor difference witch is totally normal since we can’t repeat exactly what happen in the past. Both of corrections came from rallying from a massive dump, the 2008 crash and 2020 Covid crash.Even the 200 and 50 MA average are doing exactly the same thing.
It will be interesting to see if price action will continue mirroring 2010 correction.
This analysis has started with checking the weekly chart RSI and try to find similar condition of a dump with the RSI price action .
It will be interesting to see if price action will continue mirroring 2010 correction.
This analysis has started with checking the weekly chart RSI and try to find similar condition of a dump with the RSI price action .
免責聲明
這些資訊和出版物並不意味著也不構成TradingView提供或認可的金融、投資、交易或其他類型的意見或建議。請在使用條款閱讀更多資訊。