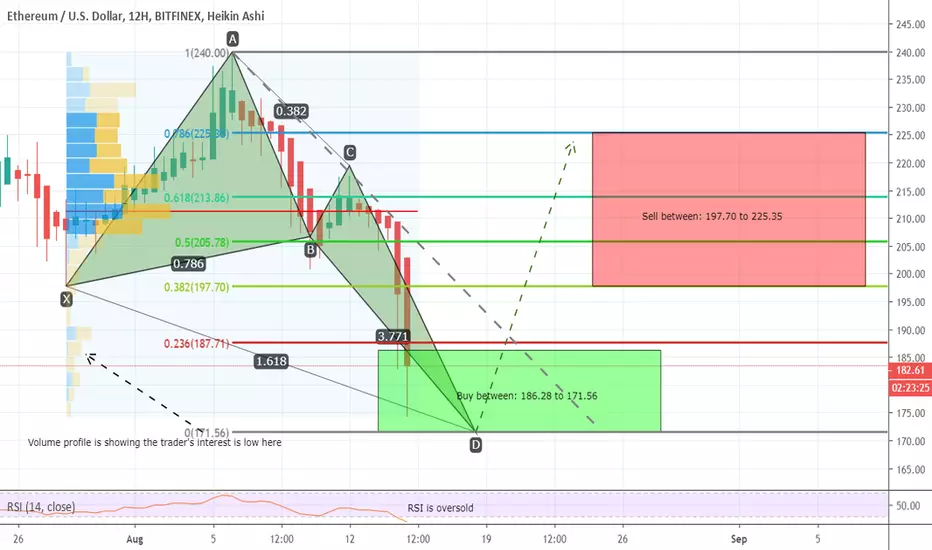
Priceline of Ethereum / US Dollar has formed a bullish butterfly and entered in potential reversal zone.
RSI is oversold.
Volume profile of complete pattern is showing less interest of traders at PRZ area.
I have usded Fibonacci sequence to set the targets and those targets are as below:
Buy between: 186.28 to 171.56
Sell between: 197.70 to 225.35
The MACD is strong bearish therefore I would suggest to take long position after when atleast 6hr MACD's histogram gives weak bearish signals.
Regards,
Atif Akbar (moon333)
交易結束:目標達成
By the grace of Allah the most high this trade gave more than 13 percent profit sofar.免責聲明
這些資訊和出版物並不意味著也不構成TradingView提供或認可的金融、投資、交易或其他類型的意見或建議。請在使用條款閱讀更多資訊。