ETH/USDT – Multi-Degree Terminal Advance: Daily Wave ⑤ of C Inside Weekly Wave C (Ending Diagonal)
1️⃣ Higher-Timeframe Context (Weekly)
ETH has been unfolding a large corrective A-B-C structure from the all-time high.
The current rally is Wave C of that correction.
Structural note: On the weekly, Wave 4 overlaps Wave 1 → violates standard impulse rules → the entire Wave C is taking the form of an Ending Diagonal.
Why this matters:
Ending diagonals appear in terminal positions (Wave 5 of an impulse or Wave C of a correction).
They often end with a throw-over above the upper trendline, followed by sharp and deep reversals.
2️⃣ Intermediate-Timeframe Context (Daily)
On the daily, we are in:
Wave ⑤ of daily Wave C.
That daily Wave C is also the final leg of weekly Wave C.
Implication:
Two degrees (daily & weekly) are scheduled to terminate together → high-probability major turning point.
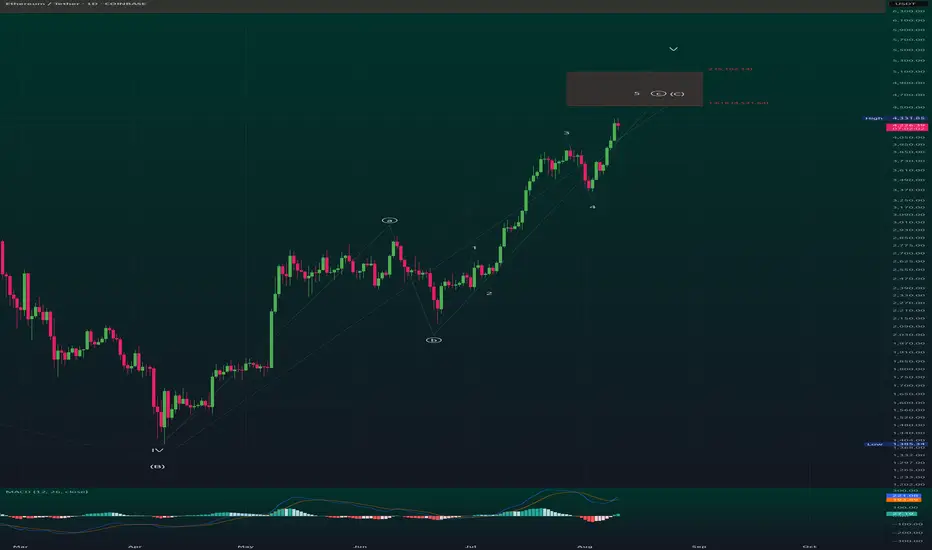
3️⃣ Structure & Internal Wave Count
From the IV(B) low in April, ETH has advanced in five overlapping sub-waves:
Wave 1 – steady breakout leg.
Wave 2 – shallow pullback.
Wave 3 – strongest rally to date.
Wave 4 – pullback overlapping Wave 1 territory → confirms diagonal.
Wave 5 – ongoing final push into target zone.
Internals of each wave show a-b-c formations, consistent with diagonal rules.
4️⃣ Fibonacci Target Confluence
Anchor: IV(B) low → Wave 3 high → Wave 4 low
1.618 extension: $4,531 → first resistance.
2.000 extension: $5,102 → primary target.
Upper wedge projection / throw-over: $5,500–$5,650.
These levels also align with weekly fib projections for Wave C → creating a multi-timeframe resistance cluster.
5️⃣ Momentum & Divergence
MACD (Daily): Histogram making lower highs while price makes higher highs → early bearish divergence.
RSI (Daily & Weekly): Approaching overbought with flattening momentum → consistent with terminal phases.
Volume: Gradual contraction during the advance; watch for final spike on throw-over.
6️⃣ Scenarios
A) Terminal Top Scenario (Base Case)
Price completes Wave ⑤ of C inside the $4,531–$5,102 box.
Possible throw-over into $5,500–$5,650 on ETF hype.
Followed by swift rejection back inside wedge → break of Wave-4 low confirms top.
Targets after confirmation:
First: Wedge base / 0.382 retrace (~$3,800).
Next: 0.5 retrace (~$3,500).
Extended: Origin of diagonal (~$2,900).
B) ETF Extension Scenario
Price consolidates above $5,100 and pushes toward $5,500–$5,650.
Still part of Wave ⑤, just a stretched terminal before reversal.
Same confirmation rules: break of Wave-4 low validates reversal.
7️⃣ Invalidation & Risk Levels
Bearish invalidation: Break of Wave-4 low = high-probability top.
Bullish invalidation: Sustained breakout + consolidation above $5,650 would require re-evaluating the diagonal scenario.
8️⃣ Trade Plan (Non-Advice)
Aggressive fade: Short into $4,531–$5,102, add near $5,500–$5,650 if reached, stop above wedge throw-over.
Conservative: Wait for daily close back inside wedge and break of Wave-4 low, then short pullbacks.
Positioning note: Size down in diagonals — volatility spikes at turns.
9️⃣ Key Chart Annotations for Publishing
Wedge trendlines from Wave-II(B) low to Wave-IV(B) low.
Label 1–2–3–4–5 (with a-b-c internals) on daily.
Highlight $4,531, $5,102, and $5,500–$5,650 zones.
Mark Wave-4 low and wedge base with "Top Confirmed Below Here".
Add MACD/RSI divergence notes in top-right.
📌 Summary
ETH is in the final stages of a multi-degree ending diagonal:
Daily Wave ⑤ of C inside Weekly Wave C.
Both degrees likely terminate in $4,531–$5,102, with throw-over potential to $5,500–$5,650.
Once confirmed, expect a fast, deep retrace — this is a terminal pattern with macro top potential.
1️⃣ Higher-Timeframe Context (Weekly)
ETH has been unfolding a large corrective A-B-C structure from the all-time high.
The current rally is Wave C of that correction.
Structural note: On the weekly, Wave 4 overlaps Wave 1 → violates standard impulse rules → the entire Wave C is taking the form of an Ending Diagonal.
Why this matters:
Ending diagonals appear in terminal positions (Wave 5 of an impulse or Wave C of a correction).
They often end with a throw-over above the upper trendline, followed by sharp and deep reversals.
2️⃣ Intermediate-Timeframe Context (Daily)
On the daily, we are in:
Wave ⑤ of daily Wave C.
That daily Wave C is also the final leg of weekly Wave C.
Implication:
Two degrees (daily & weekly) are scheduled to terminate together → high-probability major turning point.
3️⃣ Structure & Internal Wave Count
From the IV(B) low in April, ETH has advanced in five overlapping sub-waves:
Wave 1 – steady breakout leg.
Wave 2 – shallow pullback.
Wave 3 – strongest rally to date.
Wave 4 – pullback overlapping Wave 1 territory → confirms diagonal.
Wave 5 – ongoing final push into target zone.
Internals of each wave show a-b-c formations, consistent with diagonal rules.
4️⃣ Fibonacci Target Confluence
Anchor: IV(B) low → Wave 3 high → Wave 4 low
1.618 extension: $4,531 → first resistance.
2.000 extension: $5,102 → primary target.
Upper wedge projection / throw-over: $5,500–$5,650.
These levels also align with weekly fib projections for Wave C → creating a multi-timeframe resistance cluster.
5️⃣ Momentum & Divergence
MACD (Daily): Histogram making lower highs while price makes higher highs → early bearish divergence.
RSI (Daily & Weekly): Approaching overbought with flattening momentum → consistent with terminal phases.
Volume: Gradual contraction during the advance; watch for final spike on throw-over.
6️⃣ Scenarios
A) Terminal Top Scenario (Base Case)
Price completes Wave ⑤ of C inside the $4,531–$5,102 box.
Possible throw-over into $5,500–$5,650 on ETF hype.
Followed by swift rejection back inside wedge → break of Wave-4 low confirms top.
Targets after confirmation:
First: Wedge base / 0.382 retrace (~$3,800).
Next: 0.5 retrace (~$3,500).
Extended: Origin of diagonal (~$2,900).
B) ETF Extension Scenario
Price consolidates above $5,100 and pushes toward $5,500–$5,650.
Still part of Wave ⑤, just a stretched terminal before reversal.
Same confirmation rules: break of Wave-4 low validates reversal.
7️⃣ Invalidation & Risk Levels
Bearish invalidation: Break of Wave-4 low = high-probability top.
Bullish invalidation: Sustained breakout + consolidation above $5,650 would require re-evaluating the diagonal scenario.
8️⃣ Trade Plan (Non-Advice)
Aggressive fade: Short into $4,531–$5,102, add near $5,500–$5,650 if reached, stop above wedge throw-over.
Conservative: Wait for daily close back inside wedge and break of Wave-4 low, then short pullbacks.
Positioning note: Size down in diagonals — volatility spikes at turns.
9️⃣ Key Chart Annotations for Publishing
Wedge trendlines from Wave-II(B) low to Wave-IV(B) low.
Label 1–2–3–4–5 (with a-b-c internals) on daily.
Highlight $4,531, $5,102, and $5,500–$5,650 zones.
Mark Wave-4 low and wedge base with "Top Confirmed Below Here".
Add MACD/RSI divergence notes in top-right.
📌 Summary
ETH is in the final stages of a multi-degree ending diagonal:
Daily Wave ⑤ of C inside Weekly Wave C.
Both degrees likely terminate in $4,531–$5,102, with throw-over potential to $5,500–$5,650.
Once confirmed, expect a fast, deep retrace — this is a terminal pattern with macro top potential.
免責聲明
這些資訊和出版物並不意味著也不構成TradingView提供或認可的金融、投資、交易或其他類型的意見或建議。請在使用條款閱讀更多資訊。