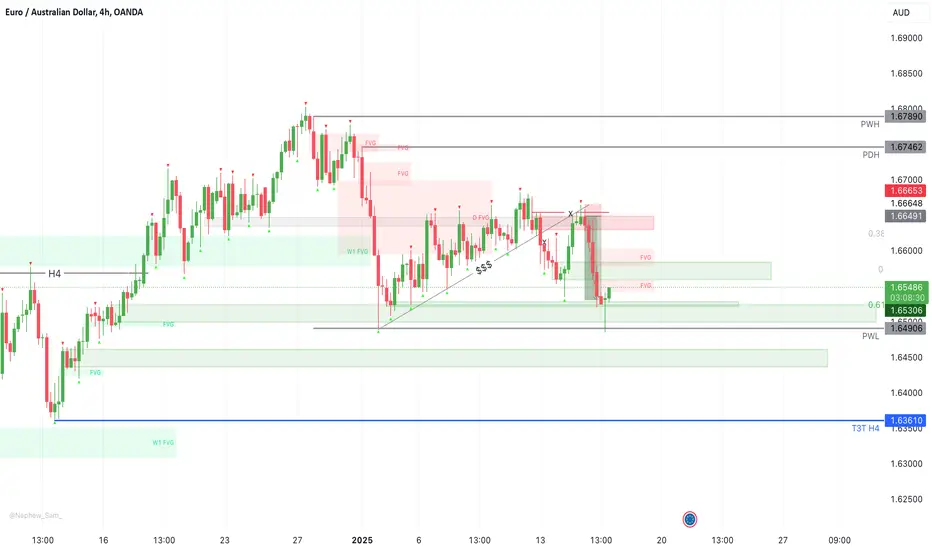
W1: The higher timeframe shows an uptrend, but the current wave is downward. Price is trading within the boundaries of PWL (Previous Week Low) and PWH (Previous Week High), indicating a corrective phase within the broader trend.
D1: The dominant trend is also upward, with the current wave downward, acting as a correction within the larger structure.
H4: A deep correction of over 61.8% has occurred. Trend liquidity has been taken out, followed by a pullback to the trendline, and another liquidity sweep, signaling a potential continuation of the corrective move.
Trade Idea:
This counter-trend setup aims to join the downward corrective wave of the larger uptrend. The liquidity sweeps, combined with a pullback to the trendline, provide potential entry opportunities for short positions, targeting the completion of the correction.
Key Levels:
Resistance: Around the trendline and liquidity sweep zones.
Bullish order block: Potential targets
Recommendation:
Look for confirmation of the continuation of the downward wave, such as price stalling without breaking previous candle highs or lows, trendline rejections, or engulfing candle with the retest.
Risks:
A sudden reversal in alignment with the larger uptrend could invalidate the trade idea.
Liquidity sweeps can lead to false breakouts, especially in corrective phases.
Conclusion:
This idea targets a short-term opportunity to align with the corrective downward wave of the larger uptrend. By leveraging liquidity structure and trendline interactions, traders can identify precise entry points while maintaining tight risk control.
免責聲明
這些資訊和出版物並不意味著也不構成TradingView提供或認可的金融、投資、交易或其他類型的意見或建議。請在使用條款閱讀更多資訊。