Trade idea.
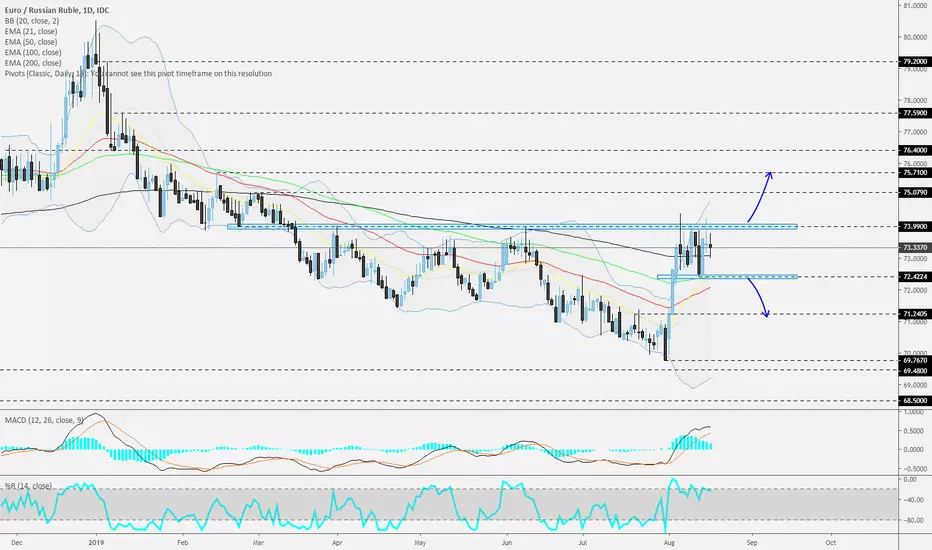
EURRUB could be forming a flag on the daily chart. Currently, the pair is sitting around its 200 EMA. For now, we will sit back, relax and wait for a clear break through one of the highlighted areas before we examine a further directional move. If the pair breaks through the 74.00 zone and closes a daily candle above it, this might confirm a possible flag and the rate may accelerate further, as more buyers could be joining in.
Please see the chart for details.
Don't forget your stop-loss.
註釋
Please join our daily live quick technical market overview webinars - Trader’s Espresso and Trader’s Tea Time - on YouTube.Trader’s Espresso – 06:00 GMT
Trader’s Tea Time – 13:15 GMT
免責聲明
這些資訊和出版物並不意味著也不構成TradingView提供或認可的金融、投資、交易或其他類型的意見或建議。請在使用條款閱讀更多資訊。
免責聲明
這些資訊和出版物並不意味著也不構成TradingView提供或認可的金融、投資、交易或其他類型的意見或建議。請在使用條款閱讀更多資訊。