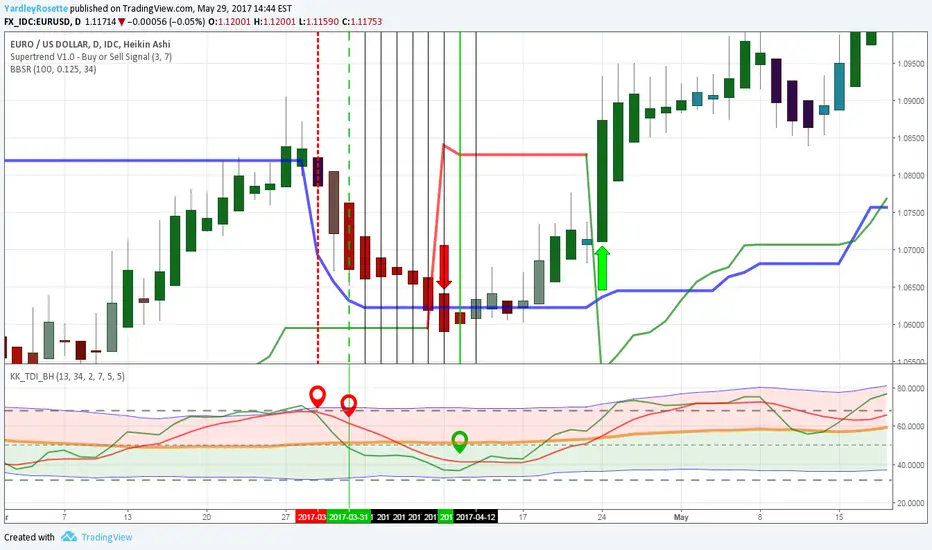
RSI/TSI cross down signal ocurred.
RSI/TSI remains bearish, though 1H Dynamic Index indication, simple/generic buy entry conditions/rules of:
RSI/TSI having been oversold, MBL risen from near 32, & RSI/TSI cross MBL up & RSI to cross above Volatility Band High were met.
Lower Time Frames indicate bullish movement within Daily chart.
Daily chart RSI/TSI cross up follows, bullish trend>>
免責聲明
這些資訊和出版物並不意味著也不構成TradingView提供或認可的金融、投資、交易或其他類型的意見或建議。請在使用條款閱讀更多資訊。
免責聲明
這些資訊和出版物並不意味著也不構成TradingView提供或認可的金融、投資、交易或其他類型的意見或建議。請在使用條款閱讀更多資訊。