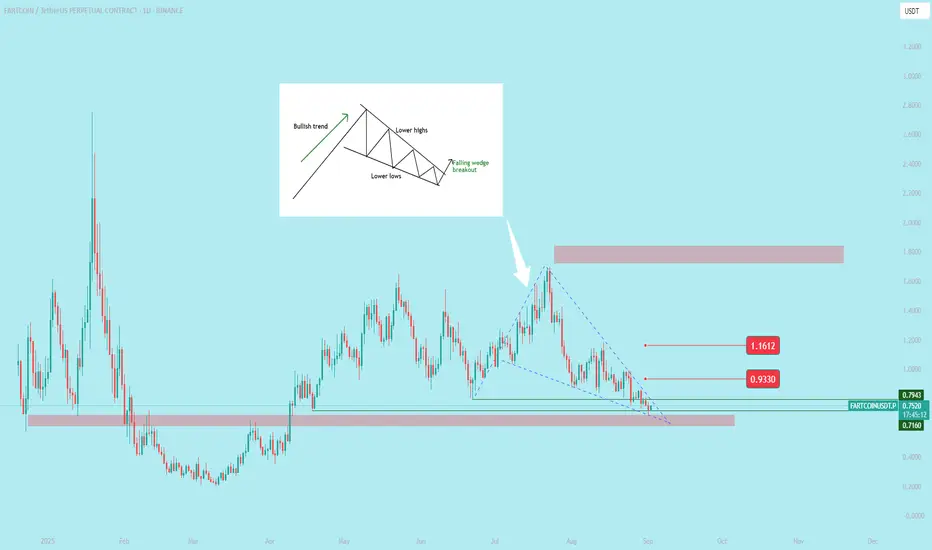
The falling wedge is a bullish chart pattern in technical analysis that signals a potential price reversal to the upside.
Key characteristics of a falling wedge
Downward-sloping trendlines: The pattern is contained by an upper resistance line connecting lower highs and a lower support line connecting lower lows.
Converging lines: The space between the two trendlines narrows as the pattern progresses, indicating a decrease in volatility and easing selling pressure.
Declining volume: Trading volume typically decreases as the wedge forms, which confirms that the downward momentum is fading.
Bulkowski's statistics: According to research by chart pattern expert Thomas Bulkowski, the falling wedge pattern has a higher success rate for upward breakouts (around 68%) than for downward ones, reinforcing its bullish bias.
免責聲明
這些資訊和出版物並非旨在提供,也不構成TradingView提供或認可的任何形式的財務、投資、交易或其他類型的建議或推薦。請閱讀使用條款以了解更多資訊。
免責聲明
這些資訊和出版物並非旨在提供,也不構成TradingView提供或認可的任何形式的財務、投資、交易或其他類型的建議或推薦。請閱讀使用條款以了解更多資訊。