📊 Technical Analysis Overview (Daily Timeframe)
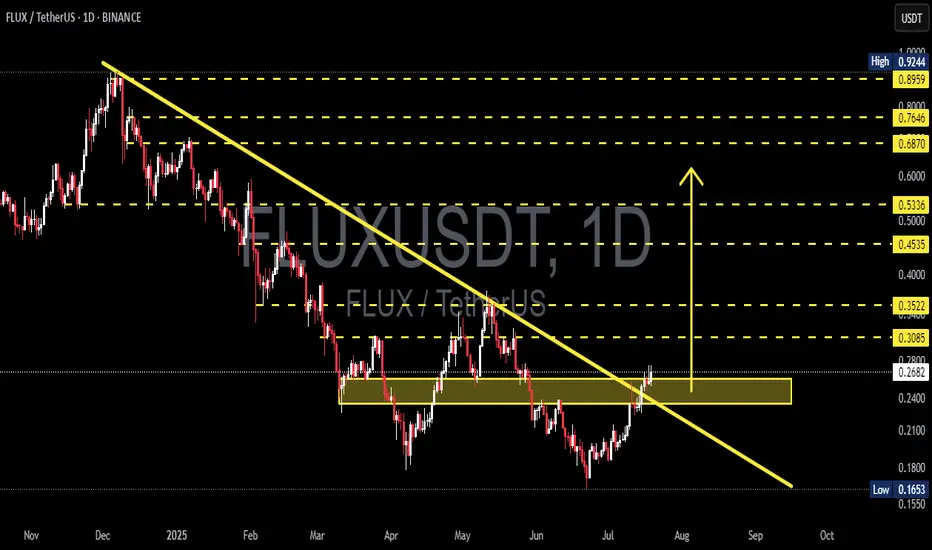
After months of persistent downtrend pressure since late 2024, FLUX/USDT has finally flashed a high-probability bullish reversal signal. The recent breakout above a long-standing descending trendline may mark the beginning of a new bullish structure that could fuel an explosive upside move.
🔍 Market Structure & Technical Pattern
✅ Descending Trendline Breakout:
FLUX has successfully broken out of the dominant bearish trendline that has acted as resistance since December 2024. This breakout is an early sign of a trend reversal, shifting momentum in favor of the bulls.
✅ Demand Zone Reclaim (0.22 – 0.26 USDT):
This critical horizontal range has served as both support and resistance in recent months. Price has now reclaimed this zone with strength, indicating renewed buying pressure and a possible shift into accumulation or markup phase.
✅ Bullish Breakout Candle:
A strong bullish candle has closed above both the descending trendline and the demand zone, confirming breakout strength and increasing the odds of bullish continuation.
✅ Potential Bullish Continuation Setup:
If the price holds above 0.26 and prints a higher low, this will likely confirm a bullish structure and support a continuation move toward key resistance levels.
📈 Bullish Scenario – Potential Upside Targets
Should bullish momentum sustain, here are the major resistance levels to watch:
1. 0.3085 USDT – Immediate resistance zone.
2. 0.3522 USDT – Historical horizontal resistance.
3. 0.4535 – 0.5336 USDT – Consolidation range from Q1 2025.
4. 0.6870 USDT – Psychological level and potential Fibonacci confluence.
5. 0.7646 – 0.8959 USDT – Long-term bullish target, up to +200% from current levels.
📌 Note: A breakout supported by strong volume will add greater confirmation to the bullish thesis.
📉 Bearish Scenario – Watch Out for a Fakeout
Although the breakout looks promising, risks remain:
If the price fails to hold above 0.26, it may result in a false breakout.
A break below 0.24 could push price back into the 0.20 – 0.22 USDT zone.
If selling intensifies, FLUX may retest the 0.1653 USDT low.
⚠️ Always manage risk. A re-entry below the broken support would invalidate the breakout setup.
📌 Summary Strategy:
✅ Confirmed breakout from multi-month downtrend structure.
🟨 Demand zone has flipped into support.
📈 Multiple upside targets with strong reward-to-risk potential.
⚠️ Watch for confirmation via volume and price retest behavior.
#FLUXUSDT #CryptoBreakout #AltcoinAnalysis #FLUX #TechnicalAnalysis #TrendReversal #CryptoTrading #TradingViewTA #PriceAction #CryptoBulls
✅ Get Free Signals! Join Our Telegram Channel Here: t.me/TheCryptoNuclear
✅ Twitter: twitter.com/crypto_nuclear
✅ Join Bybit : partner.bybit.com/b/nuclearvip
✅ Benefits : Lifetime Trading Fee Discount -50%
✅ Twitter: twitter.com/crypto_nuclear
✅ Join Bybit : partner.bybit.com/b/nuclearvip
✅ Benefits : Lifetime Trading Fee Discount -50%
免責聲明
這些資訊和出版物並不意味著也不構成TradingView提供或認可的金融、投資、交易或其他類型的意見或建議。請在使用條款閱讀更多資訊。