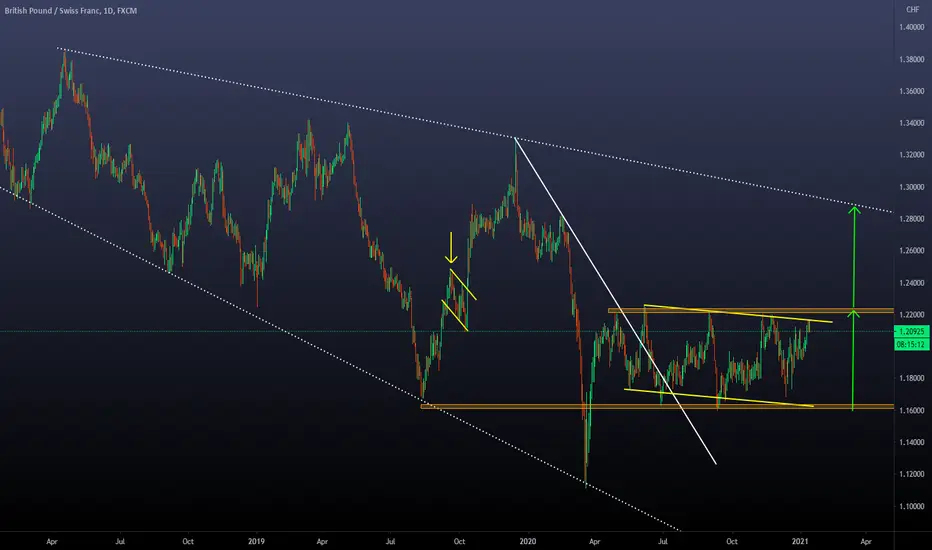
Today we will take a look at the Daily chart on GBPCHF.
-The main structure we have is the expanding descending channel
-Inside the channel, we can see a range formed by the support zone at 1.16000 and the resistance zone at 1.22000
-Technical theory tells us that the expected movement after a breakout of a range is the extension of it. We can see that the extension provides a target that converges with the higher trendline of the descending channel
-If we have a breakout, we can expect to see a corrective structure with similar proportions to the one that happened before (yellow arrow) before the big bullish movement
-This is an interesting Forex Pair to keep an eye on due to the bullish potential it can provide if we have a breakout!
免責聲明
這些資訊和出版物並非旨在提供,也不構成TradingView提供或認可的任何形式的財務、投資、交易或其他類型的建議或推薦。請閱讀使用條款以了解更多資訊。
免責聲明
這些資訊和出版物並非旨在提供,也不構成TradingView提供或認可的任何形式的財務、投資、交易或其他類型的建議或推薦。請閱讀使用條款以了解更多資訊。