When analyzing price action, timeframes serve as a convenient lens through which traders attempt to make sense of the market. They help us categorize price movement — bullish, bearish, ranging, trending, and so on — within a structured framework. But here’s the reality: candlesticks themselves aren’t real. Much like clocks or calendars, they’re simply man-made constructs — tools we've invented to measure and scale something intangible: time. I know that might sound a bit abstract, but stay with me.
While traders commonly rely on standard timeframes like the Daily, 4H, 1H, 15M, etc., it’s important to recognize that price doesn’t conform to these rigid intervals. The market moves continuously, and the “spaces between” those timeframes — like a 27-minute or 3-hour chart — are just as real. These non-standard timeframes often offer better clarity depending on the speed and rhythm of the market at any given moment.
This begs the question: How do we keep up with this ever-shifting pace? Do we constantly toggle between similar timeframes to recalibrate our analysis? Do we measure volatility? Amplitude? Period length? There’s no clear consensus, which leads to inefficiency — and in trading, inefficiency costs.
In my view, the solution lies in blending multiple nearby timeframes into a single, adaptive framework. We need a representation of price action that adjusts automatically with the speed of the market. And the answer is surprisingly simple — literally. It’s called the Simple Moving Average (SMA).
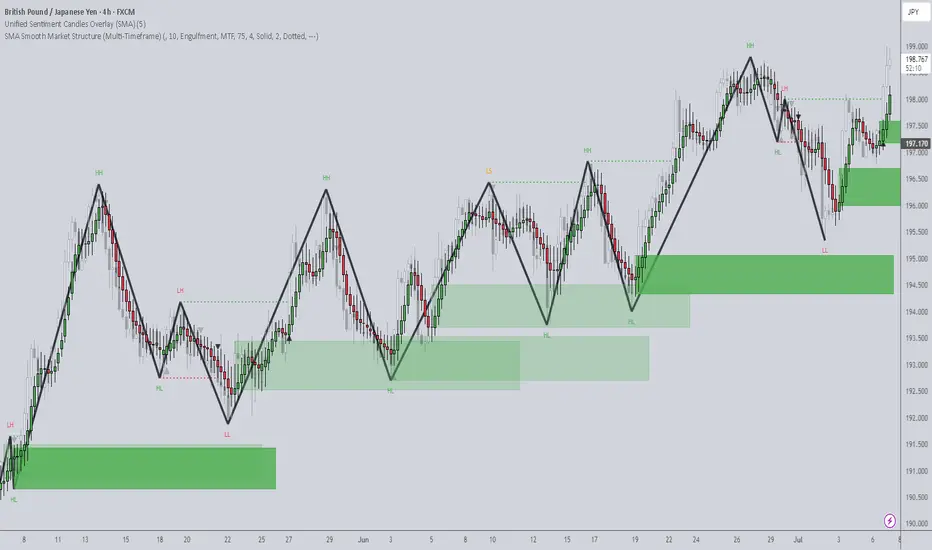
Think an SMA is just a line representing past highs, lows, or closes? It’s much more than that. When used creatively, the SMA becomes a dynamic lens that filters noise, reveals trend clarity, and smooths out irregularities in price behavior. Rather than relying on a single metric, we can combine multiple SMA variations — highs, lows, opens, closes — into one composite view of the market. This gives us a continuously adjusting snapshot of average price action.
Once we adopt this approach, everything starts to click.
•Engulfing patterns become more reliable
•Liquidity sweeps occur less frequently
•Supply and demand zones become more precise
•Market structure begins to make consistent sense
With SMA-based price action, our strategies don’t just become clearer — they become smarter.
Want to See It in Action?
If you’re interested in applying this concept to your own trading strategy, check out my TradingView profile: The_Forex_Steward. There, you’ll find the SMA Price Action indicator used in the examples shown, as well as tools that apply this methodology to:
•Supply and Demand
•Market Structure
•Market Balance Levels
•Velocity & Momentum
•And more to come!
If you found this idea helpful, be sure to follow the page. I’ll be releasing more exclusive indicators and trading concepts soon — so stay tuned!
While traders commonly rely on standard timeframes like the Daily, 4H, 1H, 15M, etc., it’s important to recognize that price doesn’t conform to these rigid intervals. The market moves continuously, and the “spaces between” those timeframes — like a 27-minute or 3-hour chart — are just as real. These non-standard timeframes often offer better clarity depending on the speed and rhythm of the market at any given moment.
This begs the question: How do we keep up with this ever-shifting pace? Do we constantly toggle between similar timeframes to recalibrate our analysis? Do we measure volatility? Amplitude? Period length? There’s no clear consensus, which leads to inefficiency — and in trading, inefficiency costs.
In my view, the solution lies in blending multiple nearby timeframes into a single, adaptive framework. We need a representation of price action that adjusts automatically with the speed of the market. And the answer is surprisingly simple — literally. It’s called the Simple Moving Average (SMA).
Think an SMA is just a line representing past highs, lows, or closes? It’s much more than that. When used creatively, the SMA becomes a dynamic lens that filters noise, reveals trend clarity, and smooths out irregularities in price behavior. Rather than relying on a single metric, we can combine multiple SMA variations — highs, lows, opens, closes — into one composite view of the market. This gives us a continuously adjusting snapshot of average price action.
Once we adopt this approach, everything starts to click.
•Engulfing patterns become more reliable
•Liquidity sweeps occur less frequently
•Supply and demand zones become more precise
•Market structure begins to make consistent sense
With SMA-based price action, our strategies don’t just become clearer — they become smarter.
Want to See It in Action?
If you’re interested in applying this concept to your own trading strategy, check out my TradingView profile: The_Forex_Steward. There, you’ll find the SMA Price Action indicator used in the examples shown, as well as tools that apply this methodology to:
•Supply and Demand
•Market Structure
•Market Balance Levels
•Velocity & Momentum
•And more to come!
If you found this idea helpful, be sure to follow the page. I’ll be releasing more exclusive indicators and trading concepts soon — so stay tuned!
免責聲明
這些資訊和出版物並不意味著也不構成TradingView提供或認可的金融、投資、交易或其他類型的意見或建議。請在使用條款閱讀更多資訊。
免責聲明
這些資訊和出版物並不意味著也不構成TradingView提供或認可的金融、投資、交易或其他類型的意見或建議。請在使用條款閱讀更多資訊。