Part 1 : Direction
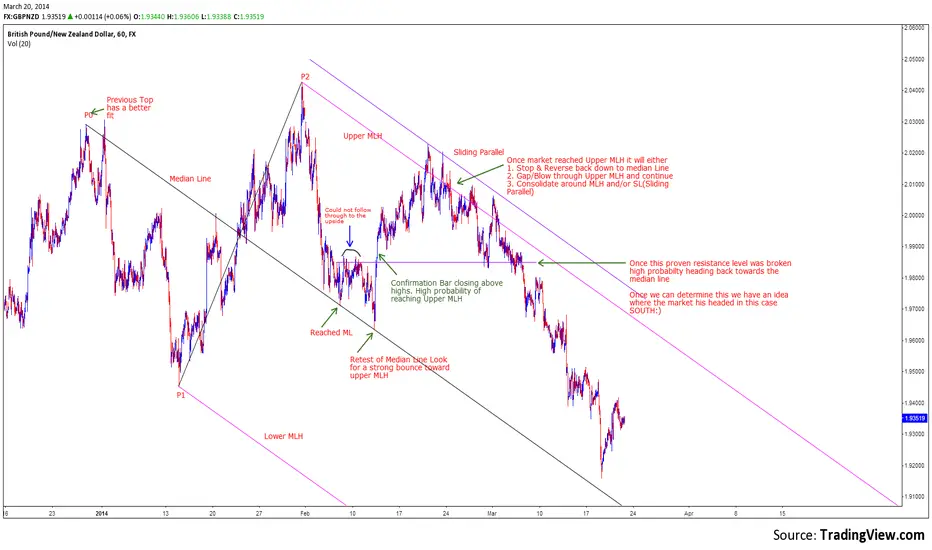
This is a 60 minute chart of the GBP/NZD pair. It was drawn after the first touch of the median line.
The horizontal purple support & resistance line within the median line set gives us directional bias as to market direction. In part two I will zoom in closer and see what the forks are telling me.
This is a 60 minute chart of the GBP/NZD pair. It was drawn after the first touch of the median line.
The horizontal purple support & resistance line within the median line set gives us directional bias as to market direction. In part two I will zoom in closer and see what the forks are telling me.
免責聲明
這些資訊和出版物並不意味著也不構成TradingView提供或認可的金融、投資、交易或其他類型的意見或建議。請在使用條款閱讀更多資訊。
免責聲明
這些資訊和出版物並不意味著也不構成TradingView提供或認可的金融、投資、交易或其他類型的意見或建議。請在使用條款閱讀更多資訊。