🔍 XAU/USD (Gold) Technical Analysis – 30-Min Chart
🟦 Trend Overview:
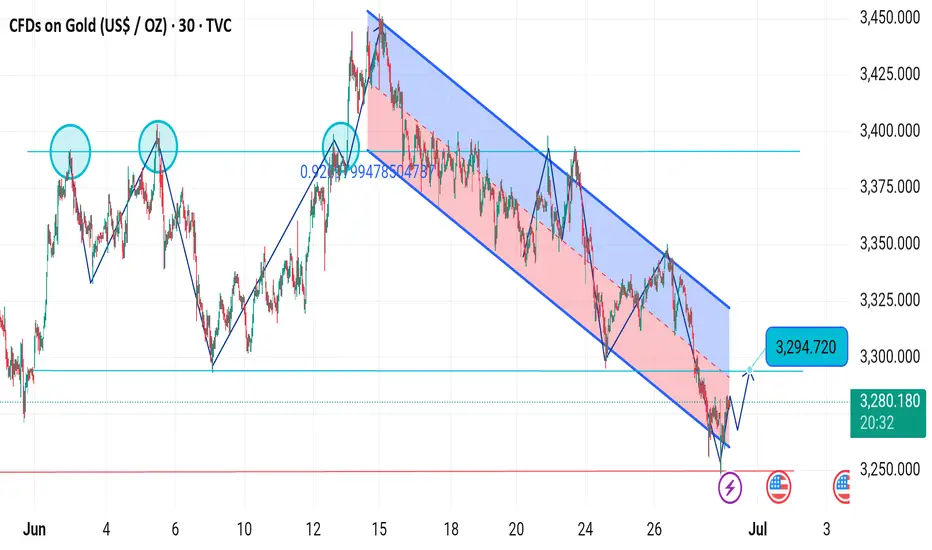
The chart shows a clear descending channel (highlighted in red and blue), indicating a short-term bearish trend.
Gold price touched the channel bottom and is now showing signs of bullish reversal.
🔄 Pattern & Key Observations:
Triple Top Formation (circled in blue) around the 3,390–3,400 zone, followed by strong sell-offs.
Price respected the channel boundaries, making lower highs and lower lows until the recent breakout attempt.
📈 Current Move:
Recent bullish candles at the channel bottom suggest a reversal attempt.
A breakout from the descending channel is underway, aiming for the resistance at 3,294.
🎯 Targets & Levels:
Immediate Resistance (Target): 3,294
Support Zone: 3,245–3,250
Breakout Confirmation: Sustained price above 3,294 may lead toward 3,320+
🧠 Conclusion:
If momentum holds, gold may continue a short-term bullish retracement to 3,294.
Watch for a confirmed breakout and volume to support further upside.
🟦 Trend Overview:
The chart shows a clear descending channel (highlighted in red and blue), indicating a short-term bearish trend.
Gold price touched the channel bottom and is now showing signs of bullish reversal.
🔄 Pattern & Key Observations:
Triple Top Formation (circled in blue) around the 3,390–3,400 zone, followed by strong sell-offs.
Price respected the channel boundaries, making lower highs and lower lows until the recent breakout attempt.
📈 Current Move:
Recent bullish candles at the channel bottom suggest a reversal attempt.
A breakout from the descending channel is underway, aiming for the resistance at 3,294.
🎯 Targets & Levels:
Immediate Resistance (Target): 3,294
Support Zone: 3,245–3,250
Breakout Confirmation: Sustained price above 3,294 may lead toward 3,320+
🧠 Conclusion:
If momentum holds, gold may continue a short-term bullish retracement to 3,294.
Watch for a confirmed breakout and volume to support further upside.
交易結束:目標達成
Enjoy your trades target reached 100%免責聲明
這些資訊和出版物並不意味著也不構成TradingView提供或認可的金融、投資、交易或其他類型的意見或建議。請在使用條款閱讀更多資訊。
免責聲明
這些資訊和出版物並不意味著也不構成TradingView提供或認可的金融、投資、交易或其他類型的意見或建議。請在使用條款閱讀更多資訊。