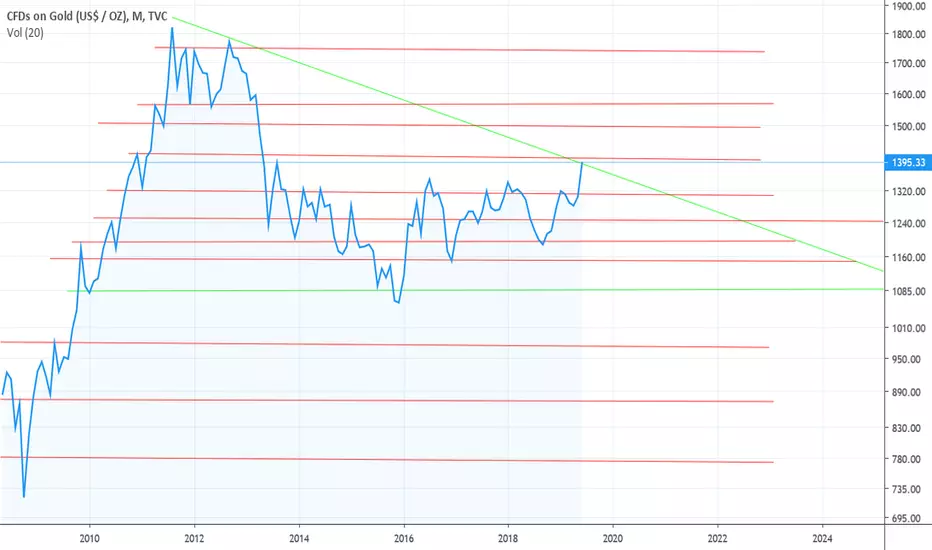
In my previous post i talked about Gold breaking flush through a Descending Triangle, i misspelt it for a Ascending Triangle. After looking again it appears as though this may be a fake out.. Time will tell per usual.
If you look at Gold on a macro 100 year chart including the wicks, Gold peaked in early 1980 2,200ish USD. After that ATH, gold sold off for 20 YEARS before finally bottoming in April 2001.
Aug 2011 was a double top, and now Gold is still "technically in a bear market until this Descending Triangle is broken!
免責聲明
這些資訊和出版物並非旨在提供,也不構成TradingView提供或認可的任何形式的財務、投資、交易或其他類型的建議或推薦。請閱讀使用條款以了解更多資訊。