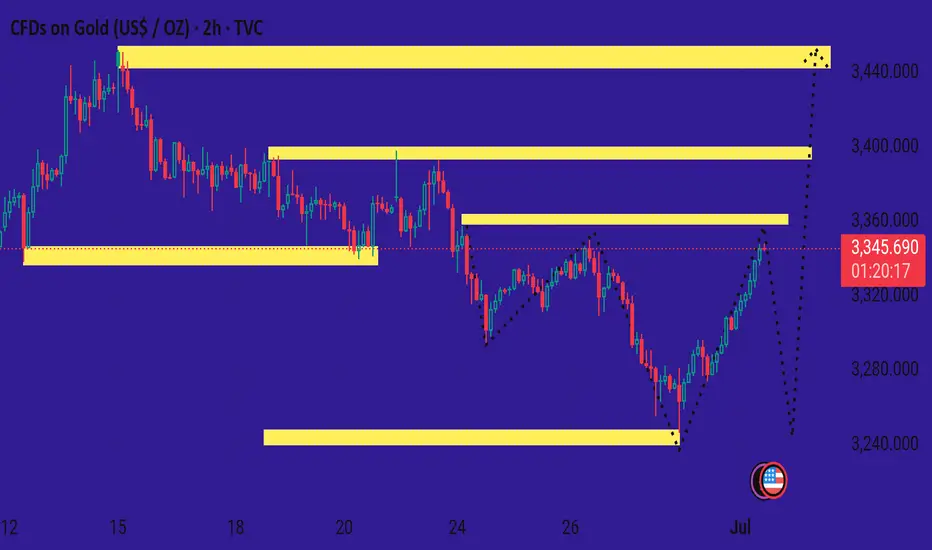
This 2-hour chart of CFDs on Gold (TVC: XAU/USD) shows a bullish reversal pattern with price currently at 3,346.197, up +43.277 (+1.31%). Here's a breakdown:
🔍 Key Technical Insights:
Support Zone (~3,240): The price reversed from a strong demand zone around 3,240, forming a "V"-shaped recovery.
Breakout of Previous Resistance (~3,320–3,340): Price broke above recent consolidation, indicating bullish momentum.
Next Resistance Levels (Marked by Yellow Boxes):
Near-Term: ~3,360
Mid-Term: ~3,400
Extended Target: ~3,440 (top supply zone)
🔁 Two Possible Scenarios (Marked by Dotted Arrows):
1. Bullish Continuation: Price targets higher zones around 3,360 → 3,400 → 3,440.
2. Bearish Rejection: If price fails to hold above 3,340, a retracement back to 3,240 support is possible.
📊 Current Momentum:
Strong bullish candles suggest continued upside pressure.
If the momentum holds above 3,340, bulls may drive it toward 3,360 and beyond.
Let me know if you'd like entry/exit strategies or confirmation with RSI/Fibonacci levels.
免責聲明
這些資訊和出版物並不意味著也不構成TradingView提供或認可的金融、投資、交易或其他類型的意見或建議。請在使用條款閱讀更多資訊。