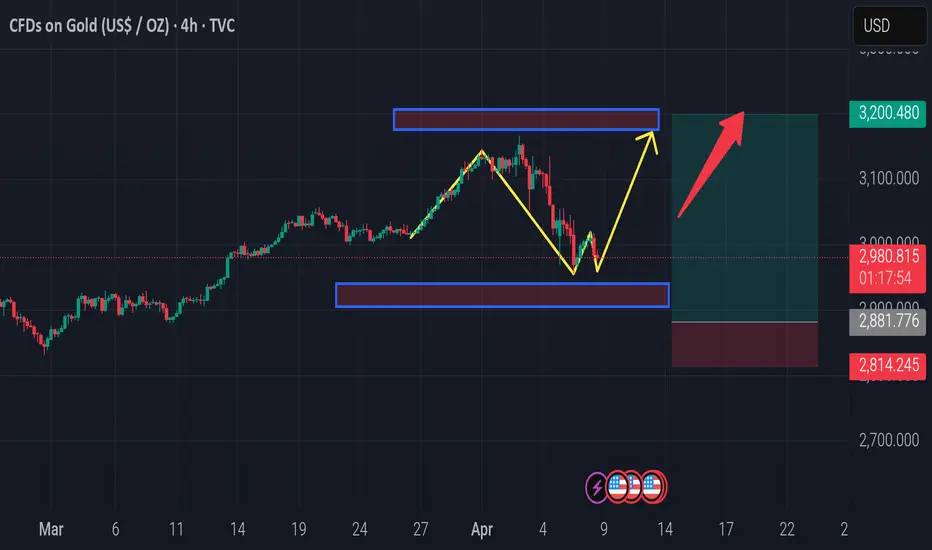
Here’s a breakdown of the idea:
Pattern Overview:
Left Shoulder: Initial dip and bounce.
Head: Deeper low followed by a recovery.
Right Shoulder: Higher low, currently forming.
Neckline: Around the $3,030–$3,040 zone (marked by the top blue box).
Bullish Setup:
If price breaks above the neckline (blue resistance zone), it could confirm the reversal.
Target based on the pattern's height (Head to Neckline) gives a potential move to ~$3,200+, aligning with your green target box.
Trade Idea:
Entry: On neckline breakout or slight retest (around $3,030–$3,050).
Target: $3,200.
Stop-Loss: Below the recent low ($2,880 or tighter depending on your risk tolerance).
Timeframe Expectation:
Given it's on a 4H chart, a breakout and follow-through to the $3,200 zone could play out in the next 2–4 weeks
Don't go anywhere Just stay tuned My Channel getting more accurate signal Daily
professional Trader
professional Trader
免責聲明
這些資訊和出版物並不意味著也不構成TradingView提供或認可的金融、投資、交易或其他類型的意見或建議。請在使用條款閱讀更多資訊。
Don't go anywhere Just stay tuned My Channel getting more accurate signal Daily
professional Trader
professional Trader
免責聲明
這些資訊和出版物並不意味著也不構成TradingView提供或認可的金融、投資、交易或其他類型的意見或建議。請在使用條款閱讀更多資訊。
