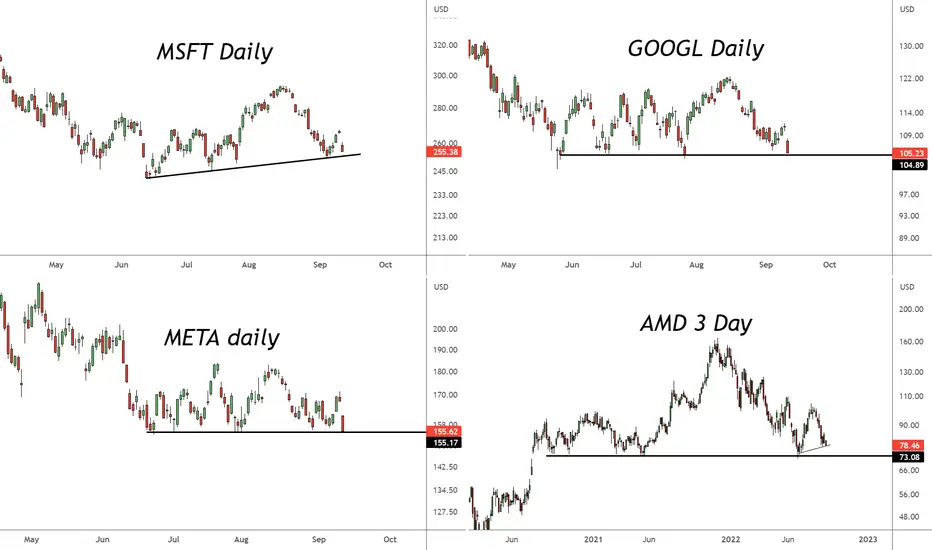
These four big tech stocks are on thin ice.
A break of these necklines suggests more downside. These levels likely indicate around 11,900 on the Nasdaq as the line in the sand.
Question is, does this lead to capitulation or a longer duration downtrend. TBD...
Nasdaq 11,900 level = red line

A break of these necklines suggests more downside. These levels likely indicate around 11,900 on the Nasdaq as the line in the sand.
Question is, does this lead to capitulation or a longer duration downtrend. TBD...
Nasdaq 11,900 level = red line
註釋
MSFT potential magnet and buy zone:GOOGL:
Will likely be better buying opportunities on stocks with better RS, but watch these levels for next major support on the Nasdaq if reached around the same time
免責聲明
這些資訊和出版物並非旨在提供,也不構成TradingView提供或認可的任何形式的財務、投資、交易或其他類型的建議或推薦。請閱讀使用條款以了解更多資訊。