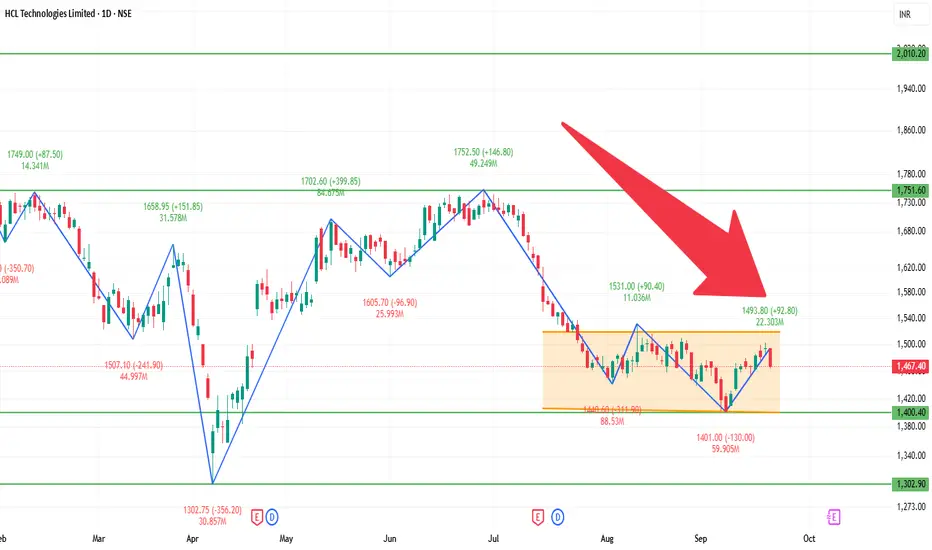
📊 Current Overview
Price is trading near ₹1,460 – ₹1,470 range.
Trend on the daily chart is showing weakness.
Stock is trading below most key moving averages (50-day, 100-day, 200-day).
🔍 Support & Resistance
Immediate Support: ₹1,450
Next Support: ₹1,430 – ₹1,420
Immediate Resistance: ₹1,470 – ₹1,475
Higher Resistance: ₹1,490 – ₹1,500
📈 Indicators
RSI (14): Neutral to slightly bearish, around mid-40s.
MACD: Weak, showing bearish crossover or flat momentum.
Trend: More sideways to bearish unless resistance levels break.
🎯 Possible Scenarios
Bullish: If HCLTECH breaks and sustains above ₹1,475, it could target ₹1,490 – ₹1,500.
Bearish: If it fails and slips below ₹1,450, it may fall towards ₹1,430 – ₹1,420.
相關出版品
免責聲明
這些資訊和出版物並非旨在提供,也不構成TradingView提供或認可的任何形式的財務、投資、交易或其他類型的建議或推薦。請閱讀使用條款以了解更多資訊。